Texture Analysis
X'Pert Texture enables to perform two distinct procedures:
Texture related calculations such as:
corrections of experimental pole figures
ODF construction
calculation of standard and inverse pole figures
Graphical representation of data and results.
Note:
X'Pert Data Collector can be used for display and analysis (peak position,
FWHM) of 2q/w,
y and f scans.
2q/w (Gonio) scans
can be analyzed more extensively in X'Pert Graphics.
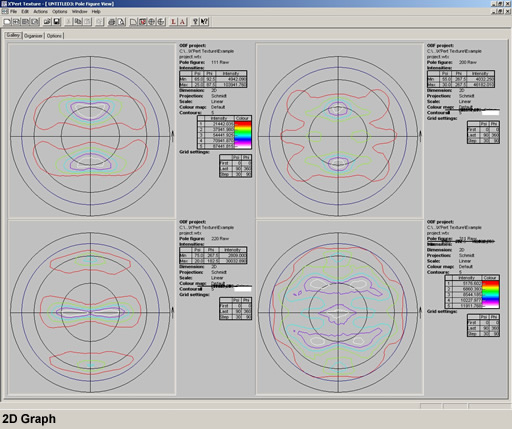
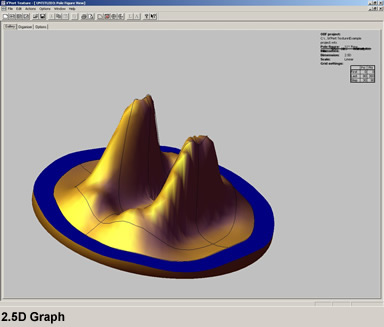
Pole figures and correction data are measured using X'Pert Data Collector and then export the data as *.rw1 and *.cor files using X'Pert Organizer. All pole figures can be displayed in 1D or 2D mode in Pole Figure View. To display either "2.5" or 3D graphs, the f step size must not be less than 0.4o (no limitation for y step).
Recommended reading:
H.P. Klug, L.E. Alexander, X-ray Diffraction Procedures for Polycrystalline & Amorphous materials, (J. Wiley & Sons Inc, New York, 1974), p. 709.
R. Jenkins, R.L. Snyder, Introduction to X-ray Powder Diffractometry, (J. Wiley & Sons Inc, New York, 1996), p 85.
H.J. Bunge, Texture Analysis in Materials Science. Mathematical Methods, (Cuvillier Verlag, Göttingen, 1993).