In this lesson, we will dive deeper into the profit equation that you learned about in Module 1 and focus on cost in more detail. Remember that:
Profits = (Average Price – Average Cost) · Quantity
It may seem obvious that you want to lower your costs, but cost is a strategic issue because of its interdependencies with the other elements of the profit equation. Costs change as “Q” changes. “P” – that is, average price – also changes as “Q” changes. So we cannot think of C in a vacuum – we want to think about what size a business should be given its cost structure.
A deep understanding of cost will help you make strategic decisions related to the following topics:
What are the features of a business that can scale and what businesses have to stay small?
How can you ensure that your growth will be profitable growth?
How should you use your accounting information and what are the limits of accounting information?
In this module, we will focus on firms’ cost structure. Analyzing your cost structure and how it will change as you scale your business is critical. If your average costs shrink substantially as you grow, there’s great opportunity to create more profit. But it doesn’t always work that way. Cost structures are driven by production technologies and they differ dramatically across industries. In fact, as we saw with the example of Aldi and Whole Foods, cost structures differ a lot even among firms in the same business depending on quality and other factors.
Cost structures also change substantially over time as technology evolves. For example, on one of our road trips, we spoke to the CEO of a plastics manufacturer that supplies parts to auto parts manufacturers. Those customers insist on price reductions of about 2% every year, so the plastics company’s business model relies on consistent cost reductions.
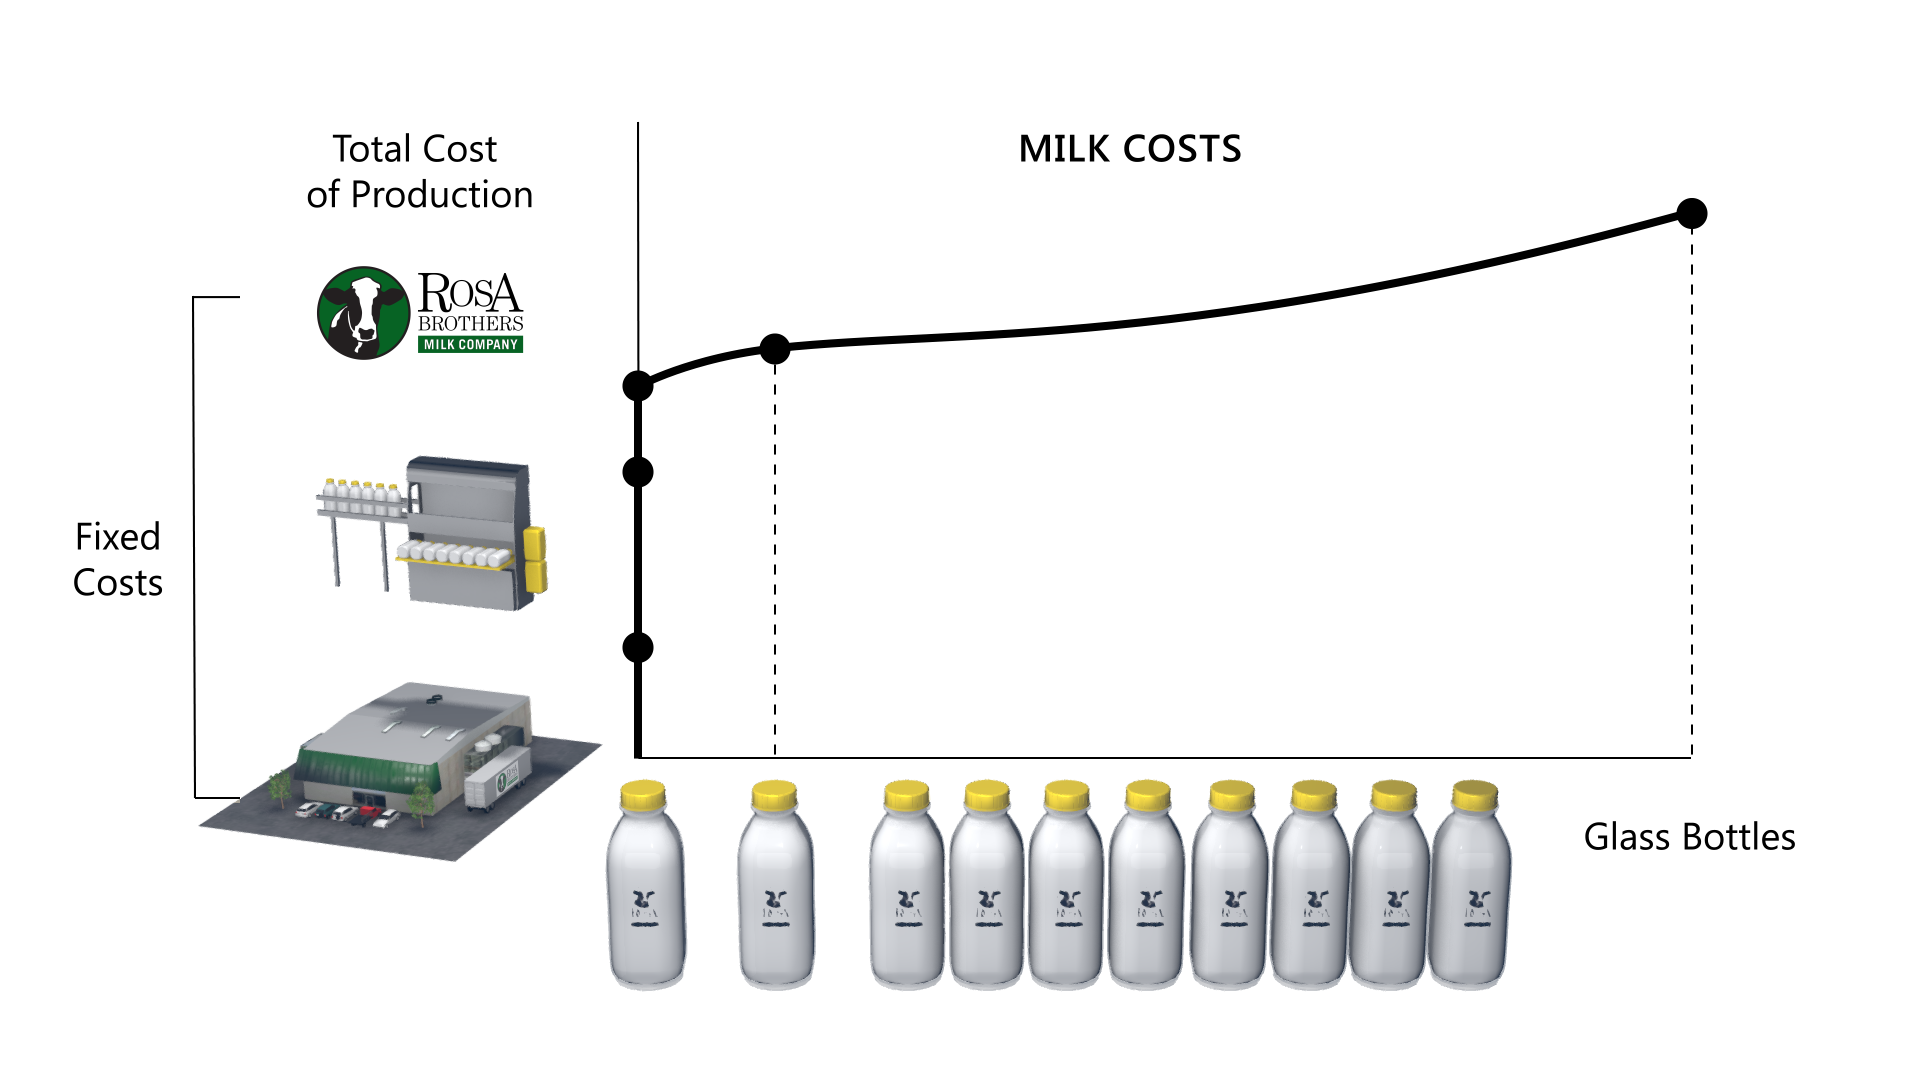
Let’s dig into costs a little more deeply and expand on the ideas of fixed cost, variable cost, and average cost that we introduced using the example of Key Fire Hose. But now we will switch gears and look at the Rosa Brothers Milk Company.
The graphs we saw in that video are all graphs of how a firm’s Total Costs increase with scale. But remember our critical equation for profits is:
Profits = (Average Price – Average Cost) · Quantity
In general, you will want to know your Average Costs to get an idea of how profitable you are. Average Costs are just Total Costs divided by “Quantity”. So we can take the Rosa Brothers Total Cost1…
and, through the wonders of division (and Excel), turn that into an average cost curve.1
Notice the pattern here, which is quite typical: Average Costs drop initially as the Rosa Brothers amortize their fixed costs. But then, when the Marginal Cost starts to rise due to overtime and pushing the machinery too hard, adding more units increases Average Costs.
1 This graph is meant as an instructional tool and is not based on real company data.
Quiz
Watch the following video to learn more details about the Rosa Brothers cost structure and answer the questions based on information in the video.
Which of these are Fixed Costs of the Rosa Brothers milking operation? Drag and drop the costs below:
Costs to Sort
Cows
Land
Feed
Machinery
Waste disposal
Fixed Costs
Let’s think about the Rosa Brothers cost as a function of how many cows they have, because we know that they are experienced and will get as much milk out of those cows as is possible. Graph the Average Cost of producing a gallon of milk as they increase the number of cows on the farm. 1
Click and drag (or touch) to draw a line.
Not all cost structures look like the examples shown for Rosa Brothers Milk Company. In fact, there are a variety of types of cost structures. Those differences are determined by the percentage and types of fixed and variable costs for each organization. As you think through your organization’s cost structure, you will need to first determine the initial cost of a single unit for your product or service and then determine how the average cost will change as you scale.
To demonstrate another type of cost structure, we will walk you through the example of River Online.
1 This interactive is meant as an instructional tool and the answer is not based on real company data.
MARGINAL COST
While Average Cost is critical in determining what your profits are, Marginal Costs can sometimes be more important. We say that the marginal cost of an additional unit of output is the extra cost you incur to produce that unit. That is, the marginal cost of a unit is your total costs if you DO produce that unit minus the total costs if you DO NOT produce that unit.
We already saw Marginal Cost in action when we built the Rosa Brothers Total Costs for their glass bottle milk production. We showed the additional cost they incurred when they produced a second bottle of milk - that was the Marginal Cost of the second bottle of milk. In fact, it’s easy to see the Marginal Cost if we just look at our graph of Total Costs. Each time we produce another unit, the Marginal Cost is the amount Total Costs go up.
For the Rosa Brothers and their milk bottling line, the marginal cost is pretty steady after the first bottle. Remember, it’s that first bottle that is particularly expensive because of the equipment and other fixed costs. What this means is that the Marginal Cost is a lot lower than the Average Cost for the second bottle, the third bottle, and so on. As they keep adding bottles, Average Cost keeps coming down because the Marginal Cost of another bottle is so much less than the average cost of the bottles that came before it.
This idea that the Marginal Cost is low relative to the Average Cost and, as a result, the Average Cost is dropping as the Rosa Brothers add more production has a name that you have surely heard: Economies of Scale. As the Rosa Brothers scale their glass bottle milk production, they reap economic benefits through lower average cost to produce. It’s that simple.
Now, if we go back to River Online, Jesper also reaps some economies of scale as he grows his business. The Marginal Cost of his second client is lower than the cost of servicing his first client, for example, and the Marginal Cost of additional clients brings his Average Costs down - at least for a while. But the cost savings, on a relative basis, are not like the more capital-intensive Rosa Brothers facility. Jesper has economies of scale, but they are not that great. Because he can only manage so many people, they don’t last all that long. As he has to spend more of his own time managing employees or he has to add a middle manager to manage them, his Marginal Costs begin to grow and soon his Average Costs actually grow if he adds another client. At this point, he no longer has economies of scale.
Before we go on, we want to take a time out to think about the potential problems your accountants can cause. Accountants are some of the most important people at your company. But accounting information can lead you to make the wrong conclusion. Let’s say the Rosa Brothers were producing this many bottles of milk and selling them at this price.
Consider this scenario: A natural grocer that wants to offer glass-bottle milk under its own label offers the Rosa Brothers a deal -- "Produce 100 bottles of milk per week just the way Rosa Brothers usually does, but stamp our store’s logo on the bottle and sell it to us for $X." $X is a value below current price, below average cost, and above marginal cost. If the Rosa Brothers say no to this deal, the store will buy the milk somewhere else.
Should the Rosa Brothers do it?
One mistake a company in this position could make would be to look at this deal using “fully allocated” costs. The price the store is offering is below the Rosa Brothers Average Cost, so an accountant who allocated overhead and depreciation to the milk the Rosa Brothers can sell to the store might say “This is a bad deal.” However, it’s a good deal for the Rosa Brothers - it raises their profits because it is above the Marginal Cost. Remember, use your accountants wisely - don’t mix up Marginal and Average Cost when making business decisions.
That aside, accounting is a nice reminder of the goal we are seeking -- profits! Economies of Scale are good because they typically help you generate profits. If your price does not go down as your quantity grows, or at least if it does not go down too much, then your profits grow as you scale the business. That’s a scalable business where bigger is better.
Let’s just say for the moment that you can keep your price high even if you sell a lot of units. Then you are making more and more money as you produce more units. The problem, however, is that Marginal Costs almost always start creeping up at some point. We already talked about this at River Online. The complexity and management time at River Online makes the Marginal Cost of their tenth client higher than the Marginal Cost of their fourth client. The same goes for the Rosa Brothers. There are lots of scale economies on the bottling line as they amortize the building and the equipment. But, after a certain point, if they want to produce more bottles of milk, they have to worry about machines breaking down and they might have to pay some overtime. Their Marginal Costs go up. So what’s the right amount to scale?
SCALABILITY
When a business starts to scale, it can be challenging to determine what size is best for the company. Economies of scale initially reduce average costs as the business grows, but eventually costs will begin to increase again. Looking at the cost structure of the business can help you determine at which point the business will have the lowest average cost. Businesses at that point are said to be operating at efficient scale. The video below explores the topic of efficient scale using the examples of Mugshots Grill and Bar, Rosa Brothers Milk Company, and River Online.1
The graph below shows sample average cost curves for several different restaurants.2 Click on a restaurant to show its cost curve.
1 We have a follow-up on River Online’s scaling plans based on a communication with Jesper Riber after the completion of the course videos. He is planning expansion to other countries near Denmark, as well as selling River Online’s services in the United States over the internet. The e-learning and organizational changes he’s working on are helping him scale at reasonable cost and the expansion to other markets is helping him keep his customers’ willingness-to-pay high.
2 This graph is meant as an instructional tool and is not based on real company data.
SUMMARY
Let’s sum up some of the key ideas we have seen in this module.
First, costs can be divided into Fixed and Variable Costs. The additional cost per unit is the marginal cost. These different types of costs determine your Average Cost, which is likely to change quite significantly as you increase from very little production to very large production.
Second, the way that Average Cost changes as you grow is a major factor in determining what is scalable and what is not. There are many other considerations in maximizing profit, but typically you want to be producing at a level where AC is at or near its minimum.
Third, technology determines costs structures and you have to adopt your business to the limits of technology. Mazzeo’s law is key – your efficient scale depends on a lot of factors, many of which are likely to be outside your control.
Finally, for the ambitious, you can sometimes find ways to innovate on the cost side. These can give you advantages relative to your competition and, in some cases, make your business more scalable.
Stanford's Digital Learning Solutions team prepared this multimedia lesson under the supervision of Professors Mike Mazzeo, Scott Schaefer, and Paul Oyer as the basis for class discussion rather than to illustrate either effective or ineffective handling of an administrative situation.


 Which of these are Fixed Costs of the Rosa Brothers milking operation? Drag and drop the costs below:


