Intracellular phospho-protein staining techniques for flow cytometry: monitoring single cell signaling events
Peter O. Krutzik1,2,3
and Garry P. Nolan2,3*
1. Department of Molecular Pharmacology, School of Medicine, Stanford University
2. Department of Microbiology and Immunology, School of Medicine, Stanford University
3. Baxter Laboratory of Genetic Pharmacology, School of Medicine, Stanford University
Running Title: Intracellular phospho-staining for FACS
Key words: phosphorylation, kinase, multi-parameter, antibodies, cell-based, signaling cascades, Alexa, phospho-protein
* Correspondence to:
Garry Nolan, Ph.D.
Baxter Laboratory of Genetic Pharmacology
Department of Microbiology and Immunology
Stanford School of Medicine
269 Campus Dr, CCSR 3230
Stanford, CA 94305
Ph: 650-725-7002
Fax: 650-723-2383
Email: gnolan@stanford.edu
Abstract
Background:
Recent advances in intracellular staining techniques, cytometer technology, fluorescent reagents, and antibody production have expanded the number of intracellular antigens that can be analyzed by flow cytometry. Measurement of protein phosphorylation with phospho-specific antibodies has given insight into kinase signaling cascades. However, available techniques for phospho-epitope staining can differ greatly, necessitating understanding the differences between the outcomes in applications of such techniques and the development of robust and reproducible methods.
Materials and
Methods:
Ten different cellular fixation and permeabilization techniques were tested for their ability to provide phospho-specific staining. Combinations of formaldehyde, methanol, ethanol, acetone, Triton X-100, and saponin were used as fixation and permeabilization reagents. Phospho-specific antibodies were labeled with Alexa dyes to provide multicolor analysis of different signaling events simultaneously within individual cells.
Results:
Fixing cells with 1.5% formaldehyde followed by permeabilization in methanol gave optimal results for pERK, pp38, pJNK, pStat1, pStat5, and pStat6 staining. Alteration of formaldehyde fixation and methanol permeabilization times affected measurements of phosphorylation induction. Phospho-specific flow cytometric analyses correlated well to Western blotting, providing cross platform validation of the technique.
Conclusion:
Measuring phosphorylation events by flow cytometry provides a rapid and efficient way to measure kinase cascades in individual cells. Stability of phospho-epitopes in methanol allows long term storage of samples prior to analysis. Multiple signaling cascades can be monitored simultaneously through the use of different fluorophore labels to determine specificity of ligands or inhibitors. Application of optimized techniques to heterogeneous cell types such as peripheral blood or murine splenocytes may allow signaling to be analyzed in immune cell subsets simultaneously.
Introduction
The analysis of cellular signaling pathways has largely been limited to biochemical manipulations on large numbers of homogeneous cells either derived in culture or purified by cell sorting techniques. Thus, systems with rare or heterogeneous cell types, such as human peripheral blood mononuclear cells (PBMC), murine splenocytes and bone marrow cells, and other primary cells have largely remained outside the scope of biochemical analysis. In addition, theories on signaling pathways, such as supersensitivity to signaling thresholds and bimodality, require analysis of cells at the single cell level (1-3). However, recent advances in staining for intracellular epitopes by flow cytometry have opened these previously obscure fields of signaling for clearer analysis (4-6).
Many epitopes have been successfully stained within cells, including viral particles (7,8), immunoglobulins (9), estrogen receptors (10), cytokines (11,12), and specific proteins such as Bcl-2 (13) and cyclooxygenase (14). Though staining of static protein molecules can provide insight into cellular responses to stimuli in long-term experiments, it does not yield information concerning the dynamic signaling events that occur rapidly after cell stimulation or stress. It is well known that signaling cascades are often driven by protein phosphorylation on downstream effectors that activate the effectors to carry out their roles. Thus, phospho-specific antibodies that recognize these active proteins might distinguish the “on-off” state of signaling events.
Several groups have demonstrated staining of phospho-epitopes for flow cytometric analysis (6). Among the molecules previously examined are Stat1 (15,16), Stat4 (17), Akt (18,19), ERK, MEK (5), cJun, p38 (20), and various others (4). The methods used to prepare cells for staining with phospho-specific antibodies differed in each case, but generally employed a fixation step with formaldehyde followed by permeabilization with alcohols, detergents, or saponin. Since many of the epitopes to be recognized are novel and might be sequestered in protected locales within cells, it remains unclear if there exists a general method (or set of methods) by which most phospho-epitopes can be stained and analyzed. For the success of such a protocol, two critical parameters must be met: 1) the initial cell fixation step must be rapid and effective in “freezing” the phosphorylation status of proteins, and 2) permeabilization steps must allow antibody access to their cognate epitopes, in the proper natured or denatured conformation, for binding. Development of a generally applicable protocol would greatly benefit multicolor, multiparameter analysis. It would also become important as new phospho-specific antibodies are created.
Thus, we sought to take a systematic approach to examining various intracellular phospho-protein staining protocols in two model systems, the mitogen activated protein (MAP) kinase cascade in Jurkat T cells (21) and the Janus kinase-signal transducer and activator of transcription (Jak-Stat) pathway in monocyte-like U937 cells (22,23). Both cascades utilize phosphorylation as a means of activating downstream effectors. In particular, the MAP kinases, extracellular regulated kinase (ERK), c-Jun N-terminal kinase (JNK), and p38, are doubly phosphorylated (on Thr and Tyr residues), then translocate into the nucleus to phosphorylate various transcription factors. Stat proteins are activated by growth factors and cytokines such as IFN-g, IL-4, and GM-CSF. Upon phosphorylation by Jaks, Stat proteins dimerize and enter the nucleus where they bind to DNA directly to modulate transcription.
To further develop flow cytometric approaches to determine phospho-epitope levels we directly compared several current methods of cell preparation, including fixation and permeabilization, staining, and storage. Reagents that are commonly used in both immunofluorescence and flow cytometry were employed: formaldehyde and glutaraldehyde as fixatives, and saponin, alcohols, and detergents as permeabilization reagents (24). We found that each of these reagents had benefits and drawbacks depending upon the circumstances in which they were employed. We also examined fluorophore choice as a variable in the labeling of phospho-specific mAbs. We find that formaldehyde fixation followed by permeabilization by methanol provides an extremely rapid and efficient means to stain a variety of intracellular phospho-epitopes, including ERK, p38, JNK, and Stats 1, 5, and 6. We also observe that phospho-epitopes are largely stable in the conditions defined herein.
The results demonstrate that it will be possible to further extend the technique to analysis of cellular subsets within complex populations or rare cell populations that are difficult to study biochemically, set up diagnostic flow cytometric assays for pathologic human samples based on phospho-protein status, or screen primary cell populations against molecular libraries to discover novel inhibitors and activators of kinase signaling cascades. We expect that variations of the techniques employed will allow for other forms of intracellular staining to be undertaken including other post-translational modification (ubiquitination, glycosylation, methylation, acetylation) or protein-protein interactions
Materials and Methods
Antibodies
The following phospho-specific mAbs used were kindly provided by BD Pharmingen and Transduction Laboratories (San Diego, CA): phospho-ERK1/2 (pT202, pY204, pERK), phospho-p38 (pT180, pY182, pp38), phospho-JNK (pT183, pY185, pJNK), phospho-Stat1 (pY701, pStat1), phospho-Stat5 (pY694, pStat5), phospho-Stat6 (pY641, pStat6). Antibodies were supplied conjugated to Alexa Fluor 488 or 647 dyes (Ax488 or Ax647, Molecular Probes, Eugene OR) with fluorophore-to-protein (FTP) ratios of 2-4, or with PE at an FTP of approximately 1.
Chemicals and cytokines
Phorbol-12-myristate 13-acetate (PMA), ionomycin (IO), anisomycin, human(h)-IFN-g, hIL-4, hGM-CSF, and BSA were from Sigma. Ampules of 16 or 32% formaldehyde (PFA) solutions were obtained from Electron Microscopy Sciences (Fort Washington, PA) and used for up to 1 week after opening.
Cell culture and stimulation
Jurkat T cells and the human monocytic lymphoma cell line, U937, were maintained in RPMI 1640 supplemented with penicillin (100 U/ml), streptomycin (100 mg/ml), L-glutamine and 10% FBS. Subconfluent (<106 cells/ml) cultures were maintained to reduce receptor downregulation and preserve cellular response to stimulation. Cells growing in complete media were treated with cytokines or chemical reagents for 10-15 minutes at 37° C before subjecting them to Western blot or phospho-specific flow cytometric analysis. Splenocytes were obtained from Balb/c mice approximately 6-8 weeks of age.
Western Blots
Stimulated cells were pelleted and lysed immediately in lysis buffer (10 mM Tris-HCl, 150 mM NaCl, 1% Triton X-100, 1 mM Na3VO4, 10 mM NaF, 5 mM EDTA, and protease inhibitor tablet (Roche, Indianapolis, IN)) for 30 min at 4° C. The cell debris was pelleted and the supernatant was diluted with sample buffer, heated, and cooled before 10-15 mg lysate was loaded onto 12% SDS-PAGE gels. Gels were transferred to PVDF membranes, blocked with PBS containing 0.1% Tween-20 (PBST) and 1% BSA for 1h, incubated with primary antibodies (all at 1:1000 dilution) for 1 h at RT, and washed 3x5 min with PBST. Rabbit anti-mouse HRP (Pierce) was then added for 30 min, the blots were washed extensively with PBST, incubated with ECL-Plus, and images were acquired on a Lumi-Imager chemiluminescent scanner (Roche). Quantitation was performed on Lumi-Analyst software by integration of relative luminescence units (RLU) in each band. Percent maximum was calculated by dividing the RLU in a sample band by the RLU in the maximally stimulated band.
Phospho-epitope staining for flow cytometry
Optimized Protocol. After testing various fixing and permeabilization conditions, the following protocol was adopted for its speed, reproducibility, and optimal staining for all tested Abs. Note that certain Abs may benefit from using slight variations to this technique, see Text.
Treated and untreated cells were fixed by adding 16% formaldehyde directly into the culture medium to obtain a final concentration of 1.5% formaldehyde. Cells were incubated in fixative for 10 min at RT and pelleted. They were then permeabilized by resuspending with vigorous vortexing in 500 ul ice-cold MeOH per 106 cells (this is an approximate number, more or less methanol can be used as long as evaporation is not significant) and incubated at 4° for at least 10 min. Cells can be stored at this point at -20°C for several weeks with minor loss in signal strength. Cells were washed twice in staining media (PBS containing 1% BSA) then resuspended in staining media at 0.5-1 x 10⁶ cells per 100 ul. Optimal concentrations (typically approximately 50 ng) of phospho-specific mAbs were added and incubated for 15-30 min at RT. The cells were washed with 15 volumes of staining media and pelleted. Finally, samples were resuspended in 100 ul staining media and analyzed.
Other protocols. Ethanol and acetone were substituted directly for methanol in the above protocol. When Triton X-100 was used as permeabilization reagent, it was included at 0.1 or 0.5% in staining medium and added to cells that had been fixed in formaldehyde. After 10 min, the cells were washed twice with staining medium, then stained as above. When saponin was used as permeabilization reagent, formaldehyde fixed cells were treated with 0.1 or 0.5% saponin in staining medium for 10 minutes, washed and then stained in the same saponin-containing buffer. After staining, cells were washed with 0.1 or 0.5% saponin. All samples were resuspended in staining medium prior to analysis.
Analysis. Samples were analyzed on a FACSCalibur cytometer (BD) equipped with 488 and 633 nm lasers, and emission filters for FITC, PE, Cy5-PE, and APC. The cytometer was routinely calibrated with Calibrite beads (BD). Stained samples may be stored for up to 16h at 4° before analysis without significant loss in intensity. Fold change was calculated by dividing the median fluorescence intensity (MFI) of the stimulated sample (MFIstim) by that of the unstimulated sample (MFIuntsim); Fold change = MFIstim/ MFIunstim. Paired t-tests were performed to compare fixation conditions and fluorophores with significant values defined as p < 0.05. Percent of maximum was calculated by dividing the MFI of each sample by that of the maximally stimulated sample, i.e. percent max = MFIsample/MFImax*100.
Results
Stimulation Conditions for Phospho-Protein Induction
In order to evaluate various techniques for their ability to efficiently and reproducibly measure protein phosphorylation events inside cells stimulation conditions that produced induction of kinase cascades had to be determined. Jurkat T cells and U937 monocytic cells were tested for their response to various stimuli including PMA, PMA and ionomycin, anisomycin, IFN-g, IL-4, and GM-CSF (Fig. 1). After stimulation, cells were split for either Western blotting or phospho-protein flow analysis with pERK, pp38, pJNK, pStat1, pStat5, and pStat6 mAbs. The figure shows the results of flow cytometric analysis with the optimized protocol outlined in this paper in order to determine the validity of the stimulations used. Cells were stimulated, fixed with 1.5% formaldehyde (PFA), permeabilized with ice-cold methanol, then stained at room temperature with the indicated fluorescently labeled phospho-specific mAbs.
As can be seen in Figure 1, phospho-protein analysis by flow cytometry correlates well with Western blotting. In Jurkat cells, PMA with or without ionomycin stimulates PKC which is known to be upstream of ERK; activation of ERK was confirmed by both Western and FACS analysis. JNK and p38 respond to various cellular stresses and are both known to be activated in response to anisomycin, a protein translation inhibitor. Intermediate levels of pp38 are evident with PMA and PMA/ionomycin stimulation by both experimental methods. In U937 cells, the expected, cognate, signaling pathways were activated via the cytokines applied. In particular IFN-g and IL-4 selectively signaled through pStat1 and pStat6, respectively. Stat5 was activated most strongly by GM-CSF, but intermediate levels were observed after IFN-γ and IL-4 stimulations. Thus, it is clear that flow cytometric analysis of phospho-proteins is able to measure on-off states, as well as graded levels of activation.
Analysis of Fixation and Permeabilization Techniques for Phospho-protein Analysis
After finding stimuli that gave consistent induction of phospho-epitopes in the two cell lines tested, we proceeded to test a panel of fixation and permeabilization methods for their ability to show the greatest ratio between treated and untreated cells (Fig. 2A). Two general techniques were employed. Methods 1-3 used organic solvents to dehydrate cells and simultaneously fix and permeabilize them. Methods 4-10 first employed a fixation step with formaldehyde (10 min) prior to permeabilization with organic solvents, Triton X-100, or saponin. Glutaraldehyde was also tested as a fixative, but due to increased background and non-specific mAb binding, we did not include those results here (data not shown). When using Triton as a permeabilization reagent, cells were treated with this agent, then washed with staining medium and stained in the absence of Triton. This technique decreased the number of cells lost to detergent lysis throughout the protocol and improved signal intensity. When saponin was used, it was kept at a constant concentration in staining buffers at all times, and was also present in wash buffers.
Figure 2B shows the results obtained by the various techniques with pERK, pp38, pStat1, and pStat5. Fold changes (MFIstim/MFIunstim) were calculated as a means of visualizing the FACS data in graphical format for comparison. Method 4, which employed a 10 min formaldehyde fix at RT followed by methanol permeabilization for 10 min at 4°C, showed the best results for pERK, pStat5, and pStat1 and was comparable to methods 3,5, and 6 for pp38. The combination of formaldehyde with organic solvents (methanol, ethanol, or acetone) was significantly better than organic solvents alone or formaldehyde-detergent combinations for pErk, pStat1, and pStat5 (p < .05). For pStat1, formaldehyde in combination with methanol provided a larger fold change than formaldehyde with ethanol or acetone (p < .05). Analysis of pp38 was roughly equivalent among the formaldehyde-solvent or solvent alone methods. Triton and saponin were largely ineffective as permeabilization reagents in the context of these mAbs, except for pp38, where they provided acceptable staining intensities. It appeared however, that saponin, a natural product isolated by extraction, differed in its effectiveness because of manufacturer lot variations and was inconsistent under our test conditions. In these experiments, formaldehyde fixation followed by methanol permeabilization was robust and consistent between experiments.
For pERK, pp38, and pStat5, the use of organic solvents alone (methods 1-3) provided good staining. Application of a one-step fixation/permeabilization protocol is attractive because of its technical ease; however, there are two major advantages to fixing with formaldehyde prior to permeabilization. First, formaldehyde appears to stabilize overall cell structure when treating later with methanol (Fig 3). When cell lines are the target of analysis, this may not be of concern. However, in complex populations such as murine splenocytes, scatter properties may be a useful diagnostic tool in analysis, and therefore efforts should be taken to maintain scatter properties. As shown in the figure, methanol alone led to a large increase in side scatter that was largely eliminated by prior treatment with formaldehyde. Formaldehyde itself does not alter scatter properties significantly. Treating with triton or saponin after fixing caused a small decrease in side scatter. Work is underway to establish effects on surface markers – in most cases we observe no changes of binding of antibodies to surface epitopes, but we have in certain cases seen complete loss of binding that is clone and epitope dependent (data not shown). The second advantage of using formaldehyde prior to organic solvent treatment is technical, as formaldehyde fixation prevents clumping typically seen when cells are immediately exposed to alcohols.
Optimization
of Fixing Percentage, Time, and Temperature.
The formaldehyde/methanol method (method 4) was further tested and optimized to determine the parameters that are critical to experimental success. The first aspect that was examined was the PFA fixation step. Initial experiments used PFA at a concentration of 1.5% for 10 min at 37° (5). PFA concentrations from 0.5 to 3% (for 10 min) were tested, with 0.5% showing slightly lower staining levels than 1.5 and 3% (data not shown). Fixation was performed by directly adding PFA to the culture media, to ensure rapid freezing of phosphorylation levels within the cells. Because cells must be removed from incubators to add PFA, we tested whether fixation at RT is different from 37° (Fig. 4B). Again, no difference was apparent, thus RT fixation was adopted because of simplicity. Finally, the time of fixation was tested. Short fixation times, i.e. of 1 min, produced approximately 30% dimmer staining than 30 min fixation for pp38, when comparing fold changes using MFIs of the populations (Fig. 4A). Fixing for 30 min decreased the fold change of pStat1 staining approximately 35%. These differences do not appear large on a logarithmic scale (in fact they are hardly noticeable), but are significant. For qualitative work, it seems that small changes to formaldehyde concentration and fixation time have only minor effects on staining intensities. However, for quantitative work, care must be taken to keep these parameters constant, as small differences in outcome can lead to experimental variability. Fixing for 10 min generally appears to work robustly, and was adopted as the standard time of fixation.
The Effect of Methanol Permeabilization/Storage and Staining Time
The methanol permeabilization step was examined for its effects on overall phospho-epitope staining by FACS. Permeabilizing for 10-30 min was found to be identical in several experiments performed and thus, longer permeabilization times were tested. Samples were stained with identical amounts of mAbs after various times in methanol. When samples were stored at 4°, staining of pERK, pp38, pStat1, and pStat6 decreased up to 50% overnight and continued to decay slowly over 1 week (data not shown). However, when stored at lower temperatures (-20° or -80°), the signal decreased overnight but then remained nearly constant for 1-5 weeks (Fig. 4C). Again, one must keep these decreases in mind for quantitative work. Staining of pStat6 was particularly interesting, as both stimulated and unstimulated samples showed a decreased staining intensity over time. Therefore, it appears that 10 min treatment with methanol is optimal, but samples can easily be stored at –20° for long term storage and later analysis (at least 5 weeks).
Staining with phospho-specific mAbs was performed for 30 min at RT in all initial experiments. Variation of the staining time led to different results depending on the antibody used (Fig. 4D). When stained for 15 min, samples tended to have a lower level of staining, both in stimulated and unstimulated samples, such that the fold change was approximately the same as when stained for 30 min. Longer staining times tended to increase the level of non-specific binding, especially for pStat6 where the fold change decreased from 9.3 to 6.5 when comparing 15 min to 1 hour. For pStat1 however, staining for 1 h increased the observed fold change approximately 50%, from 11 to 16 fold. Staining time did not appreciably affect pp38 and pERK staining levels. These data show that the various epitopes may be differentially accessible by mAbs and that there are variations between the mAbs for binding kinetics. Generally however, 30 min provided good staining levels for all of the mAbs tested and therefore was adopted for standard staining (including pJNK and pStat5, data not shown).
Stability of Phospho-Epitopes Before and After Staining
As shown above, samples may be stored in methanol for up to a month with minor loss of phospho-epitope staining. Therefore, we examined how stable the phospho-epitopes were in staining medium (PBS with 1% BSA, Fig 5A). Surprisingly, even after being stored overnight at 4° in staining medium (after PFA/methanol treatment) pERK and pp38 levels remained high, though the signals did decrease up to 20%. This experiment shows that phospho-proteins are relatively stable even in the staining medium used, and that the combination of PFA and methanol efficiently prevents cellular phosphatases from acting.
Figure 5B shows samples analyzed immediately after staining and 4-16 hours after staining. Again, fluorescence intensity remained high even in the absence of further fixation with PFA as fold changes varied less than 5% between the different acquisition times. This suggests that these mAbs, as used here, have extremely slow off-rates. The levels of pERK and pp38 were also stable after overnight incubation (data not shown). When comparing overnight storage in media prior to staining, to storage after staining one can observe that staining with mAbs leads to stabilization of the epitopes- i.e. binding of mAbs to their antigen protects the antigen from decomposition (25). Thus the data suggest that one can reliably store stained samples overnight at 4° prior to analysis
Fluorophore Labeling and Titration of Phospho-Specific mAbs
To test the relative efficacy of two different fluorophores, mAbs were labeled with either Alexa 488 or 647, two small molecule fluorophores. These molecules have the advantages of being extremely bright and photostable, and have spectral properties suitable for flow cytometry. In addition, they can be used without compensation because of the large difference between their emission spectra. Because formaldehyde fixation often leads to increases in cellular autofluorescence in the green region of the spectrum (i.e. near the emission of Alexa 488), we tested whether one of the fluorophores was superior for phospho-epitope staining by flow cytometry (Table 1). The data summarize at least 3 independent experiments that used either Alexa 488 or 647-labeled mAbs on different aliquots of the same treated samples. Fold change was calculated as in Figure 2. Conjugates of Alexa 647 produced larger fold changes for all 5 of the mAbs tested, with significant differences seen for pp38 and pStat1 (p < 0.05). However, both fluorophores worked satisfactorily with all the mAbs, providing the possibility to perform multi-color experiments in which more than one phospho-epitope is measured at a time (see below).
Of interest is the degree of labeling, or fluorophore-to-protein (FTP) ratio. The Alexa 647 conjugates used had FTP ratios of 2-3, while the Alexa 488 conjugates were used at FTPs of 2-4. Higher FTP levels (eg. >5), especially for Alexa 647, led to higher background and overall poor signals (data not shown). Therefore, it appears that with these reagents, labeling phospho-specific mAbs with low FTP ratios ensured more optimal signal to noise ratios and avoided mAb denaturation or non-specific binding.
In order to optimize staining levels, phospho-specific mAbs were titrated on unstimulated and stimulated samples to find the concentration that maximized the fold change. Very small amounts of mAb are necessary to achieve optimal staining intensities, typically 50 ng per million cells. In most cases, the highest fold change was obtained when the uninduced sample had a staining level very close to that of unstained, or isotype stained, cells. Two-fold increases or dilution in mAb concentration do not affect fold change significantly, though absolute intensities change almost linearly with mAb concentration (data not shown).
Application of Phospho-specific Flow Cytometry
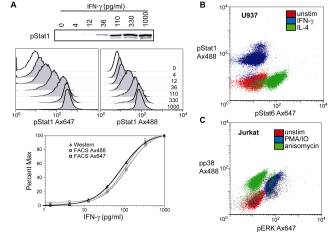
To illustrate the resolving power of simultaneous staining for phospho-epitopes, we stimulated cells under conditions that would either be expected to lead to phosphorylation of one epitope or two (Fig 6). In Fig 6A, a titration of IFN-g was performed in U937 cells. As shown previously, IFN-g produces a strong induction of pStat1. This induction can be measured by traditional Western blotting methods, or by flow cytometry. The titration curve was generated by normalizing data points to the maximally stimulated sample (1000 pg/ml), setting the MFI or RLU of that sample to 100% (see Materials and Methods). As in Figure 1, flow cytometric analysis correlated closely to Western blot analysis over a wide range of induction conditions, this time in more quantitative sense. Figure 6B and C show dual color experiments in which two phospho-epitopes were stained simultaneously in cells. U937 cells show clear pStat1 and pStat6 inductions when stimulated by IFN-g and IL-4, respectively. In Jurkat cells, PMA/ionomycin induced pERK and pp38 phosphorylation, whereas anisomycin shows only pp38 induction. These results indicate that simultaneous analysis of kinases using these reagents and by this staining protocol can provide a useful alternative to more classical methods of analysis.
Discussion
We have developed a generalized protocol for staining phospho-epitopes for flow cytometry by examining a spectrum of conditions/parameters that might impact staining levels and efficiency (see Materials and Methods). Testing indicates that the optimal protocol was resilient to modest experimental changes that could be expected to occur during staining and in the course of standard laboratory practice (i.e. time, temperature). Formaldehyde concentrations from 0.5 to 3%, fixing times from 5-30 min, permeabilization times from 10 min to 16 h, and staining times from 15 min to 1 h did alter staining levels slightly, but did not affect qualitative observations of phosphorylation (i.e. whether or not a particular protein is phosphorylated). This inherent flexibility could promote high reproducibility of staining across experimental conditions. It is clear that flow cytometric analysis of phosphorylation provides similar qualitative results to Western blot, with intermediate changes apparent by both techniques (Fig. 1). Absolute fold changes differ when comparing Western blots to flow cytometry, however normalized changes correlate closely (Fig. 6). For quantitative work and comparisons between experiments, one must keep all of the experimental parameters constant, as 30% (or more) variability is seen when fixation and permeabilization times are changed (e.g. fixing for 30 min instead of 10 min, Fig. 4). Work is underway in our laboratory to determine the quantitative nature of flow cytometry for the analysis of phospho-epitopes with the goal of normalizing results to total protein levels.
The best results in our hands were obtained by first fixing cells with formaldehyde, then permeabilizing with an alcohol, such as methanol. Formaldehyde performs two critical roles in the protocol. First, it freezes cellular processes by crosslinking proteins to one another and to themselves, likely creating a lattice of static proteins within the cell and preventing further signaling. Second, it stabilizes cell structure, a process which could be considered critical for experiments involving human peripheral blood or murine splenocytes where phenotypic gating by light scatter is an important component. As shown in Figure 3, the formaldehyde/methanol combination maintains scatter properties of splenocytes as well as the commonly used formaldehyde/saponin combination. However, after formaldehyde fixation, one would expect that intracellular proteins are in a mostly natured, or “native,” state. Permeabilization with reagents such as saponin and Triton X-100 is not expected to produce significant denaturation. One could expect that denaturation is a critical component of the staining process since phospho-specific mAbs are often generated against linear peptides corresponding to the regions surrounding the various phospho-epitopes. Thus, certain classes of mAbs may be particularly suited to recognize denatured antigens, as in Western blots. Methanol, through its dehydrating effects, may lead to some protein denaturation. In addition, methanol permeabilizes cells very effectively, allowing efficient and rapid access to nuclear antigens, such as the Stat transcription factors and activated MAP kinases tested herein. Therefore, the combination of formaldehyde and methanol might be expected to give optimal results for phospho-epitope staining with peptide-specific mAbs, particularly for nuclear antigens. Further work is required to determine whether this combination will be as effective for cytoplasmic and plasma membrane-bound epitopes.
The availability of multiple fluorophores for labeling the phospho-mAbs make multi-parameter flow cytometry plausible (Table 1 and Fig. 6). Alexa 647 tended to give better results in our experiments, likely because of greater cellular autofluorescence near the emission of Alexa 488. However, this fluorophore requires excitation at 633 nm and therefore, a two-laser cytometer. For researchers using cytometers with only a 488 laser, the Alexa 488 conjugates provided adequate fold changes but may require more careful experimental technique to ensure optimal staining. We are currently looking to expand the number of colors available for analysis. Work with PE conjugates of the mAbs showed that these reagents work in some cases, though not all (see Fig. 5 for example). The PE fluorophore is bulky and may slow staining times or block antigen binding sites.
When setting up experiments to analyze phospho-epitopes intracellularly via flow cytometry, one must keep several parameters in mind: 1) stimulation conditions must be found that efficiently induce phosphorylation of the target protein, 2) fixation must be rapid enough to freeze intracellular events, 3) fixation time must be optimized for the epitope of interest, though 10 minutes appears to be a good starting point, 4) one must ensure stability of the epitope of interest in methanol prior to long term storage, 5) if using saponin, to optimize the amount of saponin used (typically 0.1 to 0.5%), 6) determining optimal antibody titration on stimulated vs. unstimulated cells, 7) labeling the antibodies with optimal FTP ratios (typically FTPs of 2-4 are sufficient), and 8) optimizing staining time. Though the protocol outlined in this paper serves as a starting point for other phospho-epitopes, small changes may lead to greatly enhanced signal for as yet undeveloped antibodies. In addition, one must keep in mind the difference between qualitative and quantitative work. Determining whether or not a protein is phosphorylated in the qualititative sense is not critically dependent on the parameters listed above, since 10-fold shifts do not appear much different than 7-fold shifts on a logarithmic scale. However, determining quantitative fold changes requires careful control of fixation, permeabilization, and staining times, as well as antibody labeling and titration, which can all affect fold change up to 30% or more.
Although the flow cytometric methods outlined in this paper give similar results to Western blotting, analysis of phospho-epitope levels by flow cytometry possesses many advantages versus Westerns including: 1) a large dynamic range of data collection (up to 10,000 fold), 2) rapid protocols that take about 2 hours instead of the 1-2 days needed for Western blots, 3) simultaneous analysis of multiple epitopes in the same cell, 4) possibility for analysis in complex populations such as peripheral blood or murine splenocytes, and 5) possibility for rapid, quantitative experiments. Western blots do however have the advantages of 1) showing antigen size/MW, 2) indicating antibody specificity, and 3) the possibility of subcellular fractionation prior to analysis.
Work is currently underway to combine the intracellular staining methods with surface staining. Initial results suggest that surface staining can readily be combined with the optimized intracellular staining protocols described here, though we have early indications that certain surface epitopes are compromised by methanol. We expect that it will also be possible to read out non-phospho epitopes of a variety of proteins within cells, expanding the utility of the protocol further. Application of intracellular staining protocols will allow for the examination of pathways in detailed time courses and pathway-specific manners that have previously not been available. We expect that the provided protocol for phospho-epitope staining will provide an opportunity to study signaling in cells that were not accessible by biochemical techniques. In addition, because of the speed of analysis, large screening experiments can be performed to readily identify specific signaling pathway modulators at the cellular level, avoiding the pitfalls of in vitro biochemical screens.
Acknowledgements
We would like to thank Kevin Marks and Jeff Fortin for critical reading of the manuscript, and Omar Perez, Jonathan Irish, Matt Hale, and other members of the Nolan Laboratory for their input on staining methods during the course of this study. We are indebted to Leonard and Leonore Herzenberg for their continued support of this initiative and their helpful comments. P.O.K. is grateful to the Howard Hughes Medical Institute for a Predoctoral Fellowship. G.P.N. is supported by the National Heart, Lung, and Blood Institute, NIH Contract N01-HV-28183 and NIH Grant AI35304.
References
1. Fiering S, Northrop JP, Nolan GP, Mattila PS, Crabtree GR, Herzenberg LA. Single cell assay of a transcription factor reveals a threshold in transcription activated by signals emanating from the T-cell antigen receptor. Genes Dev 1990;4:1823-1834.
2. Ferrell JE, Jr., Machleder EM. The biochemical basis of an all-or-none cell fate switch in Xenopus oocytes. Science 1998;280:895-898.
3. Bagowski CP, Ferrell JE, Jr. Bistability in the JNK cascade. Curr Biol 2001;11:1176-1182.
4. Perez OD, Nolan GP. Simultaneous measurement of multiple active kinase states using polychromatic flow cytometry. Nat Biotechnol 2002;20:155-162.
5. Chow S, Patel H, Hedley DW. Measurement of MAP kinase activation by flow cytometry using phospho-specific antibodies to MEK and ERK: potential for pharmacodynamic monitoring of signal transduction inhibitors. Cytometry 2001;46:72-78.
6. Krutzik PO, Irish JM, Nolan GP, Perez OD. Analysis of protein phosphorylation and cellular signaling events by flow cytometry: techniques and clinical applications. Clin Immunol 2003;in press.
7. Kao CL, Wu MC, Chiu YH, Lin JL, Wu YC, Yueh YY, Chen LK, Shaio MF, King CC. Flow cytometry compared with indirect immunofluorescence for rapid detection of dengue virus type 1 after amplification in tissue culture. J Clin Microbiol 2001;39:3672-3677.
8. Bordignon J, Pires Ferreira SC, Medeiros Caporale GM, Carrieri ML, Kotait I, Lima HC, Zanetti CR. Flow cytometry assay for intracellular rabies virus detection. J Virol Methods 2002;105:181-186.
9. Dorn I, Schlenke P, Mascher B, Stange EF, Seyfarth M. Lamina propria plasma cells in inflammatory bowel disease: intracellular detection of immunoglobulins using flow cytometry. Immunobiology 2002;206:546-557.
10. Cao S, Hudnall SD, Kohen F, Lu LJ. Measurement of estrogen receptors in intact cells by flow cytometry. Cytometry 2000;41:109-114.
11. Lecoeur H, Ledru E, Gougeon ML. A cytofluorometric method for the simultaneous detection of both intracellular and surface antigens of apoptotic peripheral lymphocytes. J Immunol Methods 1998;217:11-26.
12. Palmblad K, Andersson U. Identification of rat IL-1beta, IL-2, IFN-gamma and TNF-alpha in activated splenocytes by intracellular immunostaining. Biotech Histochem 2000;75:101-109.
13. Verdier M, Jayat C, Ratinaud MH, Troutaud D. Optimization of cell permeabilization for multiparametric flow cytometric analysis with lectin staining. Cytometry 2000;41:55-61.
14. Ruitenberg JJ, Waters CA. A rapid flow cytometric method for the detection of intracellular cyclooxygenases in human whole blood monocytes and a COX-2 inducible human cell line. J Immunol Methods 2003;274:93-104.
15. Marodi L, Goda K, Palicz A, Szabo G. Cytokine receptor signalling in neonatal macrophages: defective STAT-1 phosphorylation in response to stimulation with IFN-gamma. Clin Exp Immunol 2001;126:456-460.
16. Fleisher TA, Dorman SE, Anderson JA, Vail M, Brown MR, Holland SM. Detection of intracellular phosphorylated STAT-1 by flow cytometry. Clin Immunol 1999;90:425-430.
17. Uzel G, Frucht DM, Fleisher TA, Holland SM. Detection of intracellular phosphorylated STAT-4 by flow cytometry. Clin Immunol 2001;100:270-276.
18. Tazzari PL, Cappellini A, Bortul R, Ricci F, Billi AM, Tabellini G, Conte R, Martelli AM. Flow cytometric detection of total and serine 473 phosphorylated Akt. J Cell Biochem 2002;86:704-715.
19. Perez OD, Kinoshita S, Hitoshi Y, Payan DG, Kitamura T, Nolan GP, Lorens JB. Activation of the PKB/AKT pathway by ICAM-2. Immunity 2002;16:51-65.
20. Zell T, Khoruts A, Ingulli E, Bonnevier JL, Mueller DL, Jenkins MK. Single-cell analysis of signal transduction in CD4 T cells stimulated by antigen in vivo. Proc Natl Acad Sci U S A 2001;98:10805-10810.
21. Johnson GL, Lapadat R. Mitogen-activated protein kinase pathways mediated by ERK, JNK, and p38 protein kinases. Science 2002;298:1911-1912.
22. Aaronson DS, Horvath CM. A road map for those who know JAK-STAT. Science 2002;296:1653-1655.
23. Kisseleva T, Bhattacharya S, Braunstein J, Schindler CW. Signaling through the JAK/STAT pathway, recent advances and future challenges. Gene 2002;285:1-24.
24. Jacobberger JW. Flow cytometric analysis of intracellular protein epitopes. In: Stewart CC, Nicholson JKA, editors. Immunophenotyping - cytometric cellular analysis. New York: John Wiley and Sons; 2000. p 361-407.
25. Lamvik J, Hella H, Liabakk NB, Halaas O. Nonlabeled secondary antibodies augment/maintain the binding of primary, specific antibodies to cell membrane antigens. Cytometry 2001;45:187-193.
Figure Legends
Figure 1 Flow cytometric analysis of phospho-epitope
levels correlates to Western blotting techniques. (A) Jurkat cells were
either unstimulated or treated with PMA (50 nM), PMA (50 nM) and ionomycin (IO,
1 mM), or
anisomycin (2 mg/ml) for 10 min at 37°C. Cells were then divided and lysed
for Western blot analysis or fixed with formaldehyde and permeabilized with
methanol for flow cytometric analysis (using optimal techniques, as discussed
in the text) with pERK1/2 Alexa (Ax) 488, pp38 Ax647, or pJNK Ax647. Unconjugated
mAbs were used for Western blots. Unstimulated samples appear as open traces in
the FACS plots. (B) U937 cells were left unstimulated or treated with IFN-g (50
ng/ml), IL-4 (10 ng/ml), or GM-CSF (10 ng/ml) for 10 min at 37°C. The cells
were split as above, and analyzed with pStat1 Ax488, pStat5 Ax488, and pStat6
Ax647. Note there is a strong correlation between Western blotting and flow
cytometric analysis with intermediate levels of pp38 and pStat5 discernible by
both methods.
|

View larger version:open into a new window |
|
|
Figure 2 Differences in fixation and
permeabilization techniques suggest an optimal protocol. (A) Ten
fixation/permeabilization methods (perm methods) were tested for their ability
to show maximal shift in phospho-epitope staining in response to stimulation of
the model cell lines. The FACS histograms show one representative experiment in
which U937 cells were treated with IFN-g (50 ng/ml) for 10 min, then fixed with 1.5% formaldehyde
(PFA) (methods 4-10), permeabilized with various reagents for 10 min, and
stained with pStat1 Ax488 for 30 min. Open histograms represent unstimulated
cells; filled plots indicate treated cells. Note there were large differences
between organic solvents (methods 4-6) and typical permeabilization reagents
such as saponin and Triton X-100 (methods 7-10) for pStat1 staining. (B)
Summary of fold changes measured with phospho-mAbs by the ten permeabilization
methods. U937 cells were stimulated with IFN-g (50 ng/ml) and GMCSF (10 ng/ml) for 10 min, and stained
with pStat1 Ax488 and pStat5 Ax647. Jurkat cells were exposed to PMA (50 nM)
and ionomycin (1 mM) for 10 min and analyzed for pERK1/2 (Ax488) and pp38
(Ax647) levels. Data represent the average of three independent experiments, in
which the trends shown were extremely consistent. The right axis represents
fold change of pStat1. Fold change = MFIstim/ MFIunstim.
|

View larger version:open into a new window |
|
|
Figure 3 Formaldehyde maintains scatter properties of permeabilized
cells. Murine splenocytes were treated with red blood cell lysis
buffer then placed in RPMI supplemented with 10% FBS for 1 hour. The cells were
then left untreated, permeabilized directly with methanol, or fixed with
formaldehyde (PFA) and then permeabilized with various reagents. A gate was
drawn around lymphocytes in the unfixed sample to serve as a reference for
effects on scatter caused by fixation/permeabilization. Numbers indicate
percentage of cells in the lymphocyte gate.
|

View larger version:open into a new window |
|
|
Figure 4 Fixation, permeabilization, and staining
times are flexible. (A) Jurkat cells were stimulated with PMA (50 nM) and
ionomycin (1 mM)(filled histograms) or left untreated (open histograms)
and stained for pp38 after fixing with 1.5% formaldehyde for 1, 10, or 30 min
and permeabilizing in methanol for 10 min. U937 cells were treated with
IFN-γ (50 ng/ml) then fixed as above and stained for pStat1. (B) U937
cells were stimulated with IFN-γ or GM-CSF (10 ng/ml) then fixed with 1.5%
formaldehyde at room temperature (20°) or 37° for 10 min and permeabilized in
methanol for 10 min. Cells were subsequently stained with pStat1 and pStat5
mAbs. (C) Jurkat and U937 cells were left untreated or stimulated with PMA and
anisomycin (1 mg/ml) or IFN-g and IL-4, respectively. At the stage of methanol
permeabilization, the cells were stored for 10 min, 1 week, or 5 weeks at –20°
before staining with the indicated mAbs for 30 min at RT. Unstimulated samples
appear as open histograms above stimulated samples that are shown as filled
histograms. (D) Jurkat and U937 cells were treated as in part C, then fixed
with formaldehyde, permeabilized for 10 min with methanol, and stained for 15,
30, or 60 min at RT with the indicated mAbs. The plots shown are representative
of at least two independent experiments.
|

View larger version:open into a new window |
|
|
Figure 5 Phospho-epitopes are largely stable both
before and after staining. (A) Jurkat cells were treated with PMA or
anisomycin (filled plots) or left unstimulated (open plots). They were fixed
and permeabilized with methanol, then stained immediately with pERK Ax488 or
pp38 PE, or incubated in staining medium (PBS + 1% BSA) overnight at 4°, before
subsequent staining. (B) U937 cells were stimulated with IFN-g or
GM-CSF (filled plots) then fixed, permeabilized, and stained with pStat1 Ax488
and pStat5 Ax647. The cells were incubated in staining medium at 4° for 4-16h
before FACS analysis.
|

View larger version:open into a new window |
|
|
Figure 6 Multiparameter applications of
phospho-specific flow cytometry. (A) U937 cells were treated with
increasing amounts of IFN-g (from 4-1000 pg/ml) for 10 min at 37°C. Cells were then
split and lysed for Western analysis, or fixed and permeabilized for flow
cytometry. The blot was probed with unlabeled pStat1, while pStat1 Ax488 or
Ax647 were used for flow analysis. Note the large dynamic range (10,000 fold)
covered by the FACS plots. Percent of maximum (using 1000 pg/ml as maximum
induction) was calculated for all three analyses and plotted versus IFN-γ
concentration. MFIs were used for flow cytometric data while integrated band
intensities were used for the Western blot.
(B) Multiparameter flow cytometric analysis of U937 cells. Cells were
left unstimulated or treated with IFN-g (50 ng/ml) or IL-4 (10 ng/ml) and stained for pStat1 and
pStat6. (C) Jurkat cells were left unstimulated or treated with PMA (50 nM) and
ionomycin (1 mM) or anisomycin (2 mg/ml) and analyzed for pERK and pp38 levels. PMA/IO shows a
strong pERK induction, as well as intermediate pp38 levels, while anisomycin
leads to exclusive activation of pp38.
|
View larger version:open into a new window |
Table 1. Alexa 647 antibody conjugates give larger fold changes than Alexa 488 conjugates.
|
|
Fold Changea |
|
|
|
Alexa
488 |
Alexa
647 |
|
pERK |
4.6
± 0.9 b |
5.5
± 1.2 |
|
pp38 |
8.1
± 1.3 |
17.1
± 3.0 c |
|
pStat1 |
12.4
± 2.5 |
42
± 7.8 c |
|
pStat5 |
3.3
± 0.2 |
5.7
± 1.5 |
|
pStat6 |
4.7
± 0.6 |
6.8
± 0.4 |
a Fold Change = MFIstim/MFIunstim. Stimulation conditions were as in above
Figures.
b Standard deviations
obtained from at least 3 independent experiments
c p < 0.05 in paired
t-test