Marge 2.0
Marge is a free little Java GUI app that allows you to manage and report
grade (or other tabular data) easily. Here's the executive summary...
-
From the editing side, Marge looks like a little spreadsheet that reads
and writes a plain tab delimted text file. Each student has their own row
and the grader can see and edit the data. Once the data is entered, Marge
has a couple easy ways to publish the data to the students.
-
The "Email Publish" feature sends the data in each row to the appropriate
student.
-
The "Web Publish" feature exports an HTML file of each row in such a way
that only the owning student can read it. This uses the existing web server
and authentication machinery available on leland. There is no separate
server or username space for Marge.
-
Marge is actively supported -- I'm using it for my own courses, so I'm
supporting it, writing docs, adding features, fixing bugs etc..
-
I thought about doing this as a web-based project -- you can imagine some
sort of php/servlet setup dealing with the grade data pretty easily. However,
doing lots of editing through HTML forms is just too painful. Marge tries
to take the best of both worlds -- the convenience of a GUI for the editing
side combined with the convenience (for the students) of email/WWW on the
reading side.
Marge has been in active use since 9/2000, with features gradually being
added.
Quick Start
If you don't want to bother reading the docs, here's how to get started...
-
The binary is in Marge.jar -- on leland you can run it with "~nick/public/marge/runmarge".
You may run it on leland, or on your desktop machine.
-
Add "name", and "user" columns and data columns like "hw1_score" and "midterm".
Or if you have a tab-delimited text file at hand, Marge can just read and
write it directly. The first line should contain the column titles.
-
Use the Column Stats command to enable statistics and histograms for the
numeric columns if you wish.
-
To use the email feature, select the columns you'd like to send, and choose
the Email Selected Columns (All Rows) menu item. It prompts you for a few
things and then emails the rows out.
-
To use the web publish feature, run where you can mount the leland file
system. Choose the Web Publish All Columns (All Rows) menu item. Web publishing
depends on a "user" column with the username for each row in order to do
the authentication for each generated HTML file. Choose the directory in
your WWW document tree where you'd like it to write the HTML-- such as
WWW/grades. One time setup: Set the directory so ordinary users do not
have read permission, but the web server does. On leland, that amounts
to system:anyuser none, system:www-servers read.
Running
Marge requires a Java 1.2 setup or later, or Mac OS8-9 with swingall.jar
and collections.jar installed (see the CS108 page for information on setting
up a Java environment). The Marge binary is essentially in Marge.jar which
on leland is at "~nick/public/marge/Marge.jar". For convenience, there's
a simple "runmarge" script there that runs the latest stable version. If
you give it a file argument, it opens with that file. There's a little
sample "test.txt" file in the directory. The Java incantation to run Marge
is simply "java -jar Marge.jar". Or if you have the JRE installed, you
may be able to just double-click Marge.jar and have the right thing happen.
There are some definite display quirks with X-windows, but none of them
are fatal. You can try different window managers -- fvwm1 seems the best.
Marge works fine on the Mac and PC. Since Marge is a Java application,
it has the standard Java issues: it's portable, but it launches slowly.
Performance is fine once it's running. It works fine with VNC.
Editing
Marge presents a pretty standard GUI for editing the table -- cut, copy,
paste for cells, add/remove for rows and colums, and sorting. Java has
a slightly broken notion of table cell focus (light outline, no cursor)
vs. text focus in the cell (blinking cursor). With cell focus, the arrow
keys move the focus from cell to cell. Typing works, but there's no cursor,
so it's confusing. With text focus, the arrow keys move the cursor around
within the text in the usual way and typing works. Double click a cell
to force text focus, otherwise you get cell focus. (This is covered at
Sun as bug
4274963
) Typing in empty cells is easy. Double click to edit existing cells.
I've patched the table edit GUI code in a couple ways: typing a regular
character activates text focus on a cell. The large text area at the top
of the table shows the text in the currently selected cell, and editing
up there works the same as editing in the cell. Ctrl-e ("edit") on a cell
jumps the cursor to the text area. Ctrl-r ("really edit") jumps the cursor
to the text area, and selects all the text. Return sends the focus back
to the cell.
Display
You can use the mouse to resize the columns and you can click drag to rearrange
the order of the columns. Use this to move the username column to be next
to the grade column for that week. Rearranging the columns does not change
the way the data is saved -- it's just a rearrangement in the GUI.
Data
Marge's native format is the plain, tab-delimited text file. The first
line of the file contains the titles of the columns. Data elements may
be empty (two adjacent tabs). There are four column titles that Marge treats
specially. It it not required that any of these columns be present, but
Marge will use them in reasonable ways if they are present.
-
name -- the student's name. Typically you want this in last,first
form so your grades sort to the same order as the registrar list, but Marge
does not enforce any particular constraint. It's just text.
-
user -- the student's user name (leland id). To use the web-publish
feature, this column must be present. This column is used as the unique-identifier
for each row during merge operations (below).
-
email -- the email address for the student. The email-publish feature
will use this column, or the user column as a fallback, so this can be
left blank for people who receive email at their leland address.
-
ta -- the student's TA.
-
private -- any column with the word 'private' in its title is always
skipped when publishing, so you can keep some columns private without worrying
about accidentally publishing them.
For both email and web publishing, the four columns -- name, user, email,
ta -- will always be included in the published reports if they are present.
Marge uses a simple cooperative locking scheme -- writing a "cs108grades.txt.lock"
type file during editing. You can have all the grades in one big file that
people take turns editing. I prefer the scheme where each TA has a fixed
set of students and manages their own grade spreadsheet.
Publishing
Marge can publish in two ways -- email and on the web. You could use one
or the other or both. I envision using the email as a notification right
when each assignment has been graded -- send each student their scores
and comments on that assignment. The web-publishing can be a coarser-grain
way to show them their whole record so they can check for errors and see
where they are. Both email and web publishing remember all your most recent
settings, so having used them once, subsequent uses are as fast as clicking
a couple buttons. Publishing can include simple statistics and histograms
for numeric columns (see Statistics below). You may want to include a fake
row for yourself just so can automatically get confirmation of the output
(just leave the scores blank and they will not mess up the statistics).
Email Publishing
Email publishing sends out the data for selected columns -- so for example
you would mail out the hw1 columns one week, the hw2 columns the next week.
To select columns, just click drag across them in any row. There are two
variants of email publishing: "all rows" sends out all the rows. This is
the most common thing to do when you've finished entering all the data
for some assignment, and want to email everyone their data. The "selected
rows" variant only emails the selected rows. This is something you would
do if you changed a few rows, and wanted to email just those students their
new data.
Each email looks like...
Here's the latest from the grade sheet
Please see the criteria at
http://www.stanford.edu/class/cs108/criteria/
name --> parlante, nick
-----
user --> nick
-----
email --> nick@cs.stanford.edu
-----
hw1 --> 1
-----
hw1comments --> mostly fine, but yoda mode didn't work right that's
right
-----
hw1late --> 1
-----
hw1 statistics
(Count=6 Mean=3.07 Median=3.7)
4.50:
4.00:**
3.50:**
3.00:
2.50:
2.00:*
1.50:
1.00:*
0.50:
0.00:
Marge 2.0.1 -- 2002-02-08 21:18:12 PST
Commenting Out
As a special case hack, you can "comment out" a row by putting two slashes
(//) before the student's name. They still show up in the spreadsheet,
but that row will be skipped during publishing and their scores will not
count in the statistics. I put this feature in because I like to keep student
data around when I think they've dropped, but I don't want it messing things
up. When you sort by name, all the commented out rows go to the bottom.
Web Publishing
Web Publishing writes an HTML file that summarizes each row. Web publishing
dumps all the non-private columns to the page -- the page is a complete
copy of the current state of the row. The statistics and text histogram
can be enabled with the Column Stats command. You could do this week by
week, or just at the end of quarter to give the students a chance to check
for errors. As with email publishing, there are "all rows" and "selected
rows" variants and statistics can be enabled column by column.
Web publishing uses an existing web server to serve up the files --
Marge just writes directories and files into the document tree of a web
server from the file system side. So for example, you could run Marge on
leland, write the files into a /usr/class/cs100/WWW/grades directory where
the leland web server can see them. Marge puts a .htaccess file into each
student grade directory so that only the correct student can see that file
-- basically leveraging the leland web authentication machinery to do the
security work. If you put a "grades" subdirectory in your course WWW directory,
then students can see their page at http://www.stanford.edu/class/csxxx/grades/USERNAME
Each web report looks like...
CS108 grade record -- let your TA know if something here is wrong.
See the criteria at http://www.stanford.edu/class/cs108/criteria
| name |
Aardvark, Katie |
| user |
katie |
| email |
aardvark@cs.stanford.edu |
| hw1 |
3.2 |
hw1 statistics
(Count=6 Mean=3.07 Median=3.7)
4.50:
4.00:**
3.50:**
3.00:
2.50:
2.00:*
1.50:
1.00:*
0.50:
0.00: |
|
| hw1comments |
Mostly fine. Scrolling seems to be wired backwards -1. Also, the ducks
fly out of the belltower the wrong way -1. I had to laugh at the smoke
effect however +0.2. |
Marge 0.9 -- 2000-10-05 11:43:24 PDT
Marge writes an .htaccess file that controls who can see the files through
the web server, but you still need to make sure they are not readable from
the file system side. On leland that amounts to the following one-time
setup of the grades directory...
elaine7:~/WWW/grades> fs sa . system:anyuser none
elaine7:~/WWW/grades> fs sa . system:www-servers read
Here are some docs on the
leland
web auth scheme.
Statistics and Text Histogram
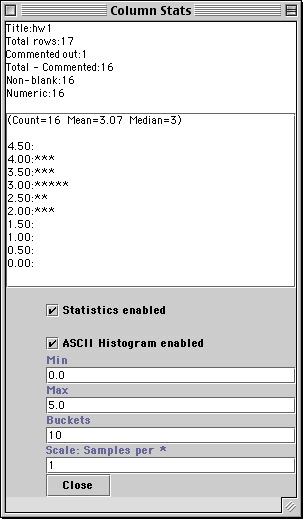
Use the "Column Stats" command to see the statistics and histogram for
a column and control if they are included in the student reports. The top
of the statistics windows shows basic counts: total rows, commented out
rows, numeric rows, etc.. If the "statistics" option is enabled (on
by default), Marge computes the mean and median for the column. If the
"histogram" option is on (off by default), Marge computes a little text
histogram of *'s for the column. If the statistics or histogram features
are enabled for a column, then they will be included in the text report
sent to the student. If the column does not appear to contain numeric data,
the statistics and histogram disable automatically
Typically, you enable the histogram for an important numeric column,
such as the hw score, and take a moment to adjust the min and max parameters
so the histogram looks reasonable. You have to enable the histogram for
the columns where you want it. Cells are included in the statistics if
they are non-blank, a parsable number, and not commented out. Note that
a blank does not just count as "0" automatically.
Graphic Histogram
Use the Graphic Histogram command to open a GUI histogram for the selected
column. Adjust the histogram and save it as an image file, to be included
on your web page or pasted into a handout. The graphical histogram is not
sent in the student reports; the text histogram is used for that since
inluding a MIME graphic in email would have problems for too many students.
However, if you prefer the graphic histogram, save it as a file and then
include the URL to it in the student report header.
Import
The "Import" command merges the contents of another marge file into the
currently open file. The column names must match up, and the "user" column
will be used as the unique identifier for each row. Marge adds new rows
and columns to the result as necessary, merges the data cells from the
two files, and detects collisions -- when one file has something for a
cell, and the other file has something else. This feature is great for
merging together data from several TA's -- they just need to be consistent
in their column names and user names.
Extras For Experts
Here are some issues that most people do not need to care about...
Column Meta Text
With Marge 2.0, the program include some meta information in the column
headers, so the first line of the text file might look like the following,
where the "hw1comments" has some meta information added to it.
name email hw1comments&width=192
Mostly, the extra text in the headers should still work with other apps
that read and write tab delimited text. Use the Save Plain Copy command
to save a copy of the file without any meta information in the first line.
Of course this loses the column meta information such as the display width
and the histogram parameters, but the actual data is preserved.
Cells With Newlines In Them
Ordinarily, each cell does not contain newlines or tabs. However, it is
actually possible to include text with newlines and tabs in a cell: select
the block of text desired, and then use the paste command to add it to
the cell. The file save/open layer will convert each newline in a cell
to a %%%%n and each tab to a %%%%t.
Comments / Questions
Please send comments, questions, bug-reports to nick.parlante@cs.stanford.edu
Versions
Originally there was this CS193k assignment I designed that basically just
edited tables. Then in 1999-2000 Tanya Laidman and I exteneded it a bit
to email out grades. Some people used that program which was known as "GradeApp".
Jason Townsend did some improvements on the UI. Then with the support of
Eric Roberts around 8/2000 I did a total re-write to create Marge 0.9.
The next summer, 8/2001, I added more features to create Marge 2.0. In
2/2002, I changed the email to put the stats at the end of the message
to create version 2.0.1.