Sumir Meghani
GSB128Q / Professor Sharpe
Spring, 2001
Analysis of Protected Investment Product (PIP) (FINAL VERSION!)
1. Terms
1.1 Name - Merrill Lynch & Co., Inc. Technology Market Index Target-Term Securities
1.2 Vendor - Merrill Lynch & Co., Inc.
1.3 Initial date of issue - August 8, 1996
1.4 Initial price per share - $10.00
Offering size: 2,500,000 Units
1.5 Added sales charge, if any - none
1.6 Underlying index or indices - Chicago Board Options Exchange (CBOE) Technology Index (TXX)
1.61 Description of underlying index or indices - A price-weighted stock index designed by the CBOE to measure the price performance of companies involved in the high technology sector.
1.7 Expiration date - August 15, 2001
1.8 Payment terms
1.81 Description of payment terms
1.811 Payments at expiration - 1) The principal amount invested ($10 per share) and 2) A "Supplemental Redemption Amount" which will be no less than zero and no greater than $10 per $10 of principal amount invested.
1.812 Payments (if any) prior to expiration - none
1.813 Options for the vendor to alter the terms or call the product prior to expiration (if any) - None from the vendor, although the CBOE has the discretion to add or remove companies from the CBOE Technology Index.
1.82 Details of payments at expiration
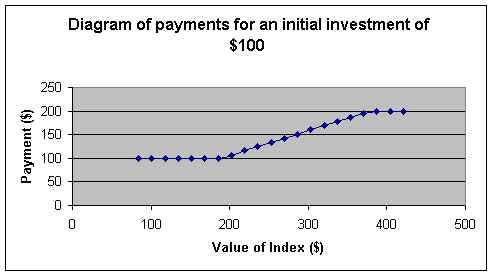
1.821 Table of payments for alternative values of the underlying index - (courtesy of CBOE website)
| Hypothetical Ending Index Value | Percentage Change Over the Starting Index Value | Total Amount Payable at Maturity | Pretax Annualized Rate of Return on the Securities* |
| 84.22 | -50% | $10.00 | 0.00% |
| 101.06 | -40% | $10.00 | 0.00% |
| 117.90 | -30% | $10.00 | 0.00% |
| 134.74 | -20% | $10.00 | 0.00% |
| 151.59 | -10% | $10.00 | 0.00% |
| 168.43** | 0% | $10.00 | 0.00% |
| 185.27 | 10% | $10.00 | 0.00% |
| 202.12 | 20% | $10.67 | 1.30% |
| 218.96 | 30% | $11.56 | 2.92% |
| 235.80 | 40% | $12.44 | 4.41% |
| 252.65 | 50% | $13.33 | 5.82% |
| 269.49 | 60% | $14.22 | 7.15% |
| 286.33 | 70% | $15.11 | 8.41% |
| 303.17 | 80% | $16.00 | 9.61% |
| 320.02 | 90% | $16.89 | 10.74% |
| 336.86 | 100% | $17.78 | 11.83% |
| 353.70 | 110% | $18.67 | 12.86% |
| 370.55 | 120% | $19.56 | 13.85% |
| 387.39 | 130% | $20.00 | 14.33% |
| 404.23 | 140% | $20.00 | 14.33% |
| 421.08 | 150% | $20.00 | 14.33% |
| *The annualized rates of return specified in the preceding table are calculated
on a semiannual bond equivalent basis. **The closing value of the Index on the Pricing Date. |
|||
1.822 Diagram of payments for an initial investment of $100 (or 100 units of relevant currency)
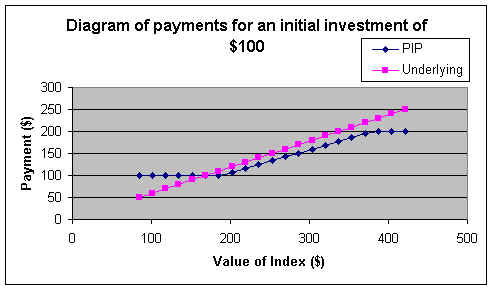
1.823 Diagram of payments for an investment of $100 (or 100 units of relevant currency) at the initial price plotted with payments for an investment of $100 in the underlying index at its initial price (modified by me)
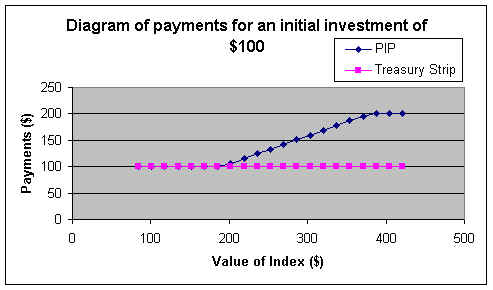
1.824 Diagram
of payments for an initial investment of $100 (or 100 units of relevant currency) at the
current price
plotted with payments for an initial investment of $100 in a treasury Strip at its current
price
2. Secondary market
2.1 Exchange where traded - NYSE
2.2 Ticker symbol - TKM
2.3 Chart of prices since inception
2.4 Chart of change in value since inception and change in value of underlying index for the same time period
3. Backing and Hedging
3.1 Guarantor or guarantors - Merrill Lynch
3.2 Information (if any) about guarantor's hedging strategy - No information
3.3 Credit rating of issuer and any guarantors - Aa3
4. Alternative strategies using available traded instruments
4.1 Options on underlying index
4.11 Nearest date to expiration date of PIP
4.111 Call option -- current price - 30.90
4.112 Put Option -- current price - 113.00
4.2 Zero-coupon bonds for expiration date - CAT U KUO 8/15/01 Yield: 2.627 Price: 99.437
5. Current Valuation
5.1 Breakeven values
5.11 Ending value for the underlying index that will make the final payment from the PIP equal to that from an investment today in the underlying index, based on investing $100 at the current prices in the PIP and the underlying index
5.12 Ending value for the underlying index that will make the final payment from the PIP equal to that from an investment today in a treasury strip, based on investing $100 at the current prices in the PIP and the strip
6. Characteristics of investors for whom the product would be suitable
6.1 Investment Horizon - Short to medium-term investment horizon (2-8 years)
6.2 Attitude towards risk - Individuals with low to medium risk tolerance
6.3 Other investments - Can be hedged with T-bonds, CDs, etc. to ensure some upside
6.4 Occupation - Blue-collar workers with teenage (or younger)-aged children