Today: modules, urllib, Jupyter notebooks
Productivity Boost: Modules Of Code To Use
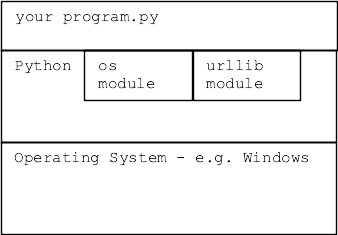
Organized modules of code for common problems. Organized, documented, and waiting for your code to use. We say that you build your code "on top of" the libraries.
We ♥ Modules
- Key question: starting a project
Is part of this solved in a module already?
- Using module code you didn't have to write is very attractive
- (This is kind of a no-brainer case to make!)
- Somebody else wrote it, you can just use it
- It's well tested
- It has real docs
- Your teammates may already be familiar with it
- CS106A we see this "module" theme a little
CS106A needs to cover fundamentals
loops, strs, dicts, files ..
Courses beyond CS106A, you will probably spend more time using modules
Module = Dependency
- When you write code using a module
- That code now depends on that module's existence
- If that module disappeared, your code would stop working
- Official, standard modules are the safest
- They are officially part of Python, they are not going away
"Standard" Modules
- Standard = included/maintained as part of Python3 install
- Can rely on this module now and in the future
- No separate install is required
- Module is installed when python is installed
1. Many Standard Modules
- Do not: memorize whole list of modules
- Do: check the list for help when starting a project
- Standard Python Modules List
- A few examples...
- math module of math functions, e.g. math.cos()
- email module for creating and parsing email messages
- random module for creating pseudo random numbers
- os module for listing directories, creating files
- datetime module of calendar functions
- zipfile module for reading/creating .zip files
- urllib module for making http requests, using data
2. Non-Standard "pip" Modules
Other modules are valuable but they are not a standard part of Python. For code using non-standard module to work, the module must be installed on that computer via the "pip" Python tool. e.g. for homeworks we had you pip-install the "Pillow" module with this command:
$ python3 -m pip install Pillow
..prints stuff...
Successfully installed Pillow-5.4.1
A non-standard module can be great, although the risk is harder to measure. The history thus far is that popular modules continue to be maintained. Sometimes the maintenance is picked up by a different group than the original module author.
Module Docs
- Every module has formal "documentation" - "docs"
- Explain what functions do
- The "abstraction" of each function
- -what it does
- -how to call it
- Demo web search: "python math module"
Gets python.org math docs
Recall: Import
How Does The Web Work?

- Browser has url ("client" side)
- Web server is running on some machine ("server" side)
- Browser sends GET request to server
- Server gets request, sends back HTML response data
- HTML is a text code
- Browser "renders" the HTML on screen
- Common request/response data types: HTML JPEG PNG GIF SVG
- Video formats MPEG4 h.265 (crazy patent problems)
- New open format "AV1" .. you heard it here first!
- Demo:
Visit python.org or sfgate.com or whatever
Right-click on page, "View Source" to see the HTML text that makes a web page
- Think of all the surfing you have done .. HTML code defines each page
HTML
HTML is plain text that looks like this, tags like <b> mark up the text.
This <b>bolded</b> text
HTML Experiment - View Source
Go to python.org. Try view-source command on this page (right click on page).
urllib 1
- CS106A theme: look at some modules you can build upon
- Python code to request an HTML page by url
- urllib - making requests to a server, getting back data
- Another example of using a standard module
- docs - urllib.request docs on python.org
- Makes a URL look like a local file mostly
>>> import urllib.request
>>> f = urllib.request.urlopen('http://www.python.org/')
>>> text = f.read().decode('utf-8')
- f.read() works once, returning bytes
- decode('utf-8') decode raw bytes -> unicode string
- Does not always work, they may be blocking python on purpose
- f.read() - all the bytes
- r.read(300) - just first 300 bytes
- Can try http: or https: for these
>>> import urllib.request
>>> f = urllib.request.urlopen('http://www.python.org/')
>>> text = f.read().decode('utf-8')
>>> # text is the HTML
>>> # use text.find('xxx') to look for something, show that slice
>>> # like text[5000:5200]
>>>
>>> f = urllib.request.urlopen('https://sfgate.com/')
>>> text = f.read().decode('utf-8')

# without >>>
import urllib.request
f = urllib.request.urlopen('http://www.python.org/')
text = f.read().decode('utf-8')
Web hello.txt Example / Exercise
import urllib.request
>>> f = urllib.request.urlopen('http://web.stanford.edu/class/cs106a/hello.txt')
>>> text = f.read().decode('utf-8')
>>> text
'Hello from CS106A url!\nWhat if there were data here?\n12,34\n25,19\n66,0\n1,2\n'
>>> lines = text.splitlines()
>>> lines
['Hello from CS106AP url!', 'What if there were data here?', '12,34', '25,19', '66,0', '1,2']
>>> lines = lines[2:]  # one way to get rid of first 2 lines
>>> lines
['12,34', '25,19', '66,0', '1,2']
>>> lines[0].split(',')
['12', '34']
Data From the Web vs. Files
- Very often data is drawn from file, into your program .. parse to list dict ..
- New picture: data is drawn from a URL
- The parsing list/dict is the same as ever
Traffic Example - Jupyter
traffic.zip Jupyter example
This is a real data set about a particular area (thanks to Jason Lin for getting this data). It measures the total seconds spent in traffic grouped by hour of the day. There is data for every day over a calendar year. It looks like this:
Parsing: we are thinking "for line in f" and "line.split(',')" here
day_of_year,hour_of_day,time_in_secs
01-01-18,0,2549
01-01-18,1,2751
01-01-18,2,2248
01-01-18,3,2440
01-01-18,4,2666
01-01-18,5,2084
01-01-18,6,2302
01-01-18,7,3410
01-01-18,8,3229
01-01-18,9,2367
01-01-18,10,2217
01-01-18,11,2082
01-01-18,12,2055
01-01-18,13,2842
01-01-18,14,2206
01-01-18,15,2178
01-01-18,16,2974
01-01-18,17,2444
01-01-18,18,2965
01-01-18,19,2714
01-01-18,20,2783
01-01-18,21,1951
01-01-18,22,2234
01-01-18,23,2263
01-02-18,0,2311
01-02-18,1,2732
01-02-18,2,2165
01-02-18,3,2377
01-02-18,4,2836
01-02-18,5,2841
01-02-18,6,2719
01-02-18,7,3671
01-02-18,8,3417
01-02-18,9,2578
01-02-18,10,2301
01-02-18,11,2357
01-02-18,12,2165
01-02-18,13,1958
...
traffic.py
- traffic.py - Open in PyCharm to see code
- traffic.py developed normally, tested
- Code to read this data into a dict
- This is CS106A bread-and-butter type code
- Add all days together, key is hour: 0..23
{0: 922633,
 1: 870481,
 2: 814756,
 3: 850357,
...
 22: 844618,
 23: 902191}
read_times()
def read_times(filename):
    """
    Read filename into a "times" dict.
    """
    with open(filename) as f:
        lines = f.readlines()
    lines.pop(0)  # first line is not data
    times = {}
    for hour in range(24):
        times[hour] = 0

    for line in lines:
        splits = line.split(',')
        hour = int(splits[1])
        time = int(splits[2])
        times[hour] += time
    return times
Jupyter Notebook
- Jupyter notebooks jupyter.org
- An extremely popular tech built on Python
- Jupyter is for calling your code, analyzing data
- PyCharm is for building your code
- Much real-world data analysis is done in Jupyter
- Built on top of regular python code
- Support an interactive notebook style
- Produce notebook - shows steps, lets others build
- Like spreadsheets, but with the full power of Python
- Install modules on your machine: "jupyter" and "matplotlib"
- Not a problem if pip install mentions that "pip" could be upgraded, can ignore that
$ python3 -m pip install jupyter
$ python3 -m pip install matplotlib
Start Jupyter
- I'll run through the small Jupyter traffic example here
- We'll do a bigger example in section
- HW8 will be a small Jupyter project
- List of Jupyter commands below
- Download the traffic.zip to get the "traffic" folder
- Get a command line prompt in the "traffic" folder, then run this command to start
$ jupyter notebook
- This should open a Jupyter tab in your browser - Jupyter works through the browser
- For this example, click on the "traffic.ipynb" for our lecture example
- To create a new doc, would use "New" Python3 to create blank notebook
Traffic Example Setup
- Jupyter notebook is a vertical series of "cells", each with some compuation
- Hit shift-return in a Jupyter cell to run it
- See cell's output right there, play with the parameters
- Typically run cells from top to bottom
- So later cells use output of earlier cells
- Click on "traffic.ipynb" to in Jupyter list to open the notebook
- OR traffic-output.html is a non-interactive picture of the final notebook state, showing all the steps and output
Traffic Example - First Half
Here is the code from the traffic notebook. Looks best in the notebook, so you can see each cell and its output.
- Shift-return to run each cell, top to bottom
- If the last line is an expression like
times
Its value gets printed after the cell
A way to confirm it worked, and think about next steps
Could use times[:10] or len(times) to avoid too much output there
- Importing "traffic.py", calling its functions to work on data here
%matplotlib inline
# Use the traffic.read_times() function to read in "times" dict.
# Times dict has keys 0..23 for hours, values are wait-times in seconds
# for traffic at that hour over a whole year.
import traffic
times = traffic.read_times('commute-times.txt')
times

# Use traffic.div_times() to scale it down to seconds for one day.
times = traffic.div_times(times, 365)
times
Commands in Jupyter
- Jupyter is ..
a. Interactive
b. Produces a notebook you can share, showing your process
- Jupyter steps
- 1. import foo - import foo module, to call its foo.bar() functions, which are typical Python/CS106A functions that get the data organized
Within Jupyter, call the foo.py functions, experiment and graph the resulting data
- 2. Shift-return - runs the code in that cell
If a list or dict as last item, prints out that data. A good way to confirm the step worked
Can say len(lst) or lst[:10] to avoid printing something huge.
Keep hitting shift-return on a cell until it's doing what you want
- 3a. Kernel > Restart Clear - Erase all the outputs, so you can shift-return from the top again
- 3b. Kernel > Restart and Run - Erase all the outputs, then run everything from the top again
- 4. File > Save and Checkpoint - save the notebook to its .ipynb file
- 5. File > Close and Halt - save notebook, close tab and return to file-list
- 6. Quit, button at top of file-list, quit the whole thing (or can ctrl-c in terminal that started it)
The Universe of Matplotlib
Matplotlib is an extremely capable and popular Python module for producing visualizations of data. Install it with "pip" as above. Matplotlib is so popular, there is no chance it is going to stop being supported. Matplotlib has a dizzying number of features. We will just scratch the surface here, so you get a feel for what's there.
For this lecture example, we'll just use the few matplotlib features shown below. If you would like more information about matplotlib in the future, see matplotlib.org
Functions in matplotlib
- matplotlib has many, many features
- We'll just use a few
- Here's an outline
# standard import line .. 'plt' is idiomatic here
import matplotlib.pyplot as plt

# 1. plot 1-d list of values. plot() uses lists
plt.plot([5, 13, 2, 7])
plt.show()


# 2. Provide both x-values and y-values lists to plot() - a common pattern
# specify color, titling
plt.title('Some Words Here')
# plot() pattern: plot( [ x-values-list ], [ y-values-list ] )
plt.plot([1, 2, 3, 4], [5, 13, 2, 7], color='red')
plt.show()
Have: times dict, want: y values list
Have "times" dict - look at it. How to make a list of the y values in order by hour? Just times.values() won't work, it's in random order.
{0: 2527.7616438356163,
 1: 2384.8794520547945,
 2: 2232.2082191780823,
 3: 2329.745205479452,
...
 20: 2421.4301369863015,
 21: 2316.26301369863,
 22: 2314.0219178082193,
 23: 2471.7561643835616}
Traffic Plot Code
...
# Plotting works on *lists* - make a len-24 "waits" list
# from the times dict.
waits = [ times[key]  for key in range(24)   ]
waits

# This is the canonical line to import matplotlib using the name "plt"
import matplotlib.pyplot as plt

# 1. Simplest: plot a 1-d list of values, no x-values specified
plt.plot(waits)
plt.show()

# 2. More typical, provide [ x-values ] and [ y-values ] lists
# Here we narrow the data to the hours 6..20.
# (Comprehension is not strictly needed here, but a common pattern)
plt.plot([i for i in range(4, 21)], waits[4:21])
plt.show()
Fancier Plotting
Plotting with more flair!
# 3. Like above, but set size, add labels, can play with line color and width
plt.figure(figsize=(10, 5))  # figsize unit is like 0.5 inch
plt.title('Commute times')
plt.xlabel('Hour of day')
plt.ylabel('Commute time in seconds')
plt.plot([i for i in range(6,21)], waits[6:21], color='purple', linewidth=9)
plt.show()