Back to CS 106A Homepage
Section 7
Written by Brahm Capoor, Andrew Tierno, Juliette Woodrow and Parth Sarin
February 23, 2020
In this week's section handout, we're covering a variety of different topics: tracing, graphics, sorting, and dictionaries amongst others. We have a few problems devoted to how graphics can be used to visualize different data, and will also have you engage in some basic analysis of the output of your Assignment 6's Mimic program to convince yourself it effectively models the text which it is fed as an input. Our goal is for you to gain a sense of how the programming skills you've been developing and are continuing to develop can be leveraged to solve some really interesting and realistic problems.
Grid Drawing
Python is commonly used in industry and academia as a tool for
managing and visualizing large amounts of data. Almost any
visualization requires the use of some sort of grid on which you can
orient your data. While Python has several toolboxes for producing
such grids automatically, in this problem we'll work through manually
making such a grid using the tkinter library. We'll
primarily employ the following functions, which we reproduce here with
the assumption that a canvas has already been created for
us:
# Draw a line between  (x1, y1) and (x2, y2), touching both
# optional: fill='red' to set color ('black' is default)
# optional: width=2 to draw a thicker line (1 is default)
canvas.create_line(x1, y1, x2, y2)
canvas.create_line(x1, y1, x2, y2, fill='red')
canvas.create_line(x1, y1, x2, y2, width=2)

# Draws text on the canvas.
# anchor=tkinter.SW means the given x,y is SouthWest corner of the tet
# of the beginning of the string. Other common choices are W (West) and NW (NorthWest)
# optional: fill='red' to set color ('black' is default)
canvas.create_text(x, y, text=a_str_value, anchor=tkinter.SW)
canvas.create_text(x, y, text=a_str_value, anchor=tkinter.SW, fill='red')
You can download the starter project for this problem
here, which comes with a
main function that's already outfitted to facilitate two
behaviours:
-
If your program is called with one integer command line argument
(i.e.
python3 draw-grid.py 10), it will produce a 500 pixel x 300 pixel grid, separated into that many rows and columns. -
If your program is called with two integer command line arguments,
(i.e.
python3 draw-grid.py 1200 800 25), it will use the first two arguments as the dimension of the grid and the third as the number of rows and columns.
Your job is to complete the following function, which the
main function will then call:
def draw_grid(width, height, n):
    """
    Divides a canvas into n rows and columns
    """
    # make canvas of specified dimensions
    canvas = make_canvas(width, height)

    # TODO: your code here

    # required line to put window on screen
    tkinter.mainloop()
The function begins by making a canvas (delineated by a blue border)
for you to separate into a grid using the
make_canvas function (which we provide), and ends by
calling tkinter.mainloop() to put the window on the
screen. It is your responsibility to actually draw the grid.
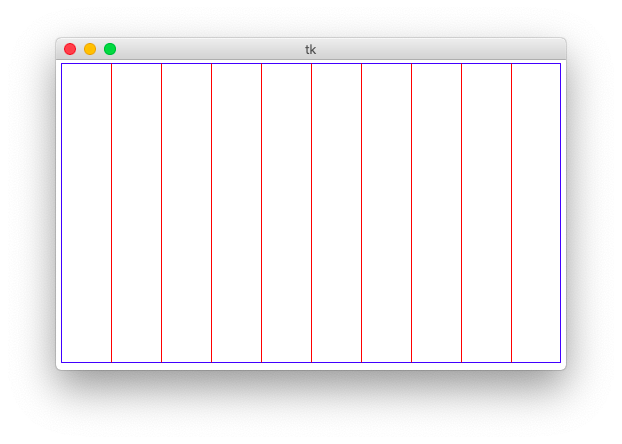
Milestone 1: Drawing column separators
We'll begin by first dividing the canvas into n vertical
columns, which is accomplished by drawing n - 1 vertical
red lines between said columns, like so:
To determine the x-coordinate of each line, compute its position as a
fraction of the entire width of the canvas, then multiply that
fraction by the canvas width. This fraction will by definition be a
number between 0 and 1, and thus will need to be represented by the
float data type. In your own code, this likely means that
you'll simply use the / operator rather than the integer
division //. Each vertical line should extend the full
height of the canvas.
Milestone 2: Drawing row separators
Now, you'll do the same thing to draw separator lines for the rows of the grid to produce a window like this:
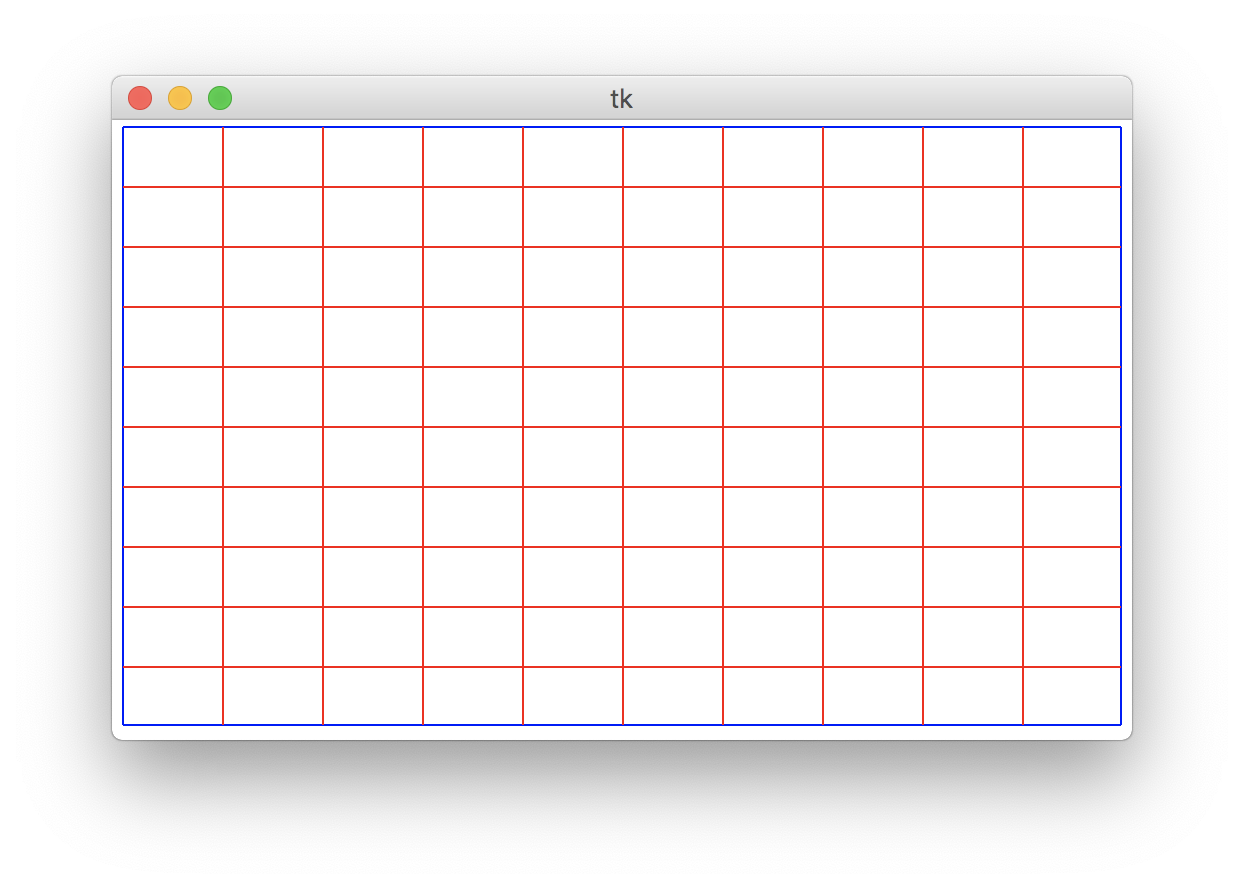
Each horizontal line should extend the full width of the canvas.
Milestone 3: Drawing labels
Finally, you'll label each of the row separation lines with its y-coordinate. Each label should be above and to the right of the leftmost end of the line, like so:
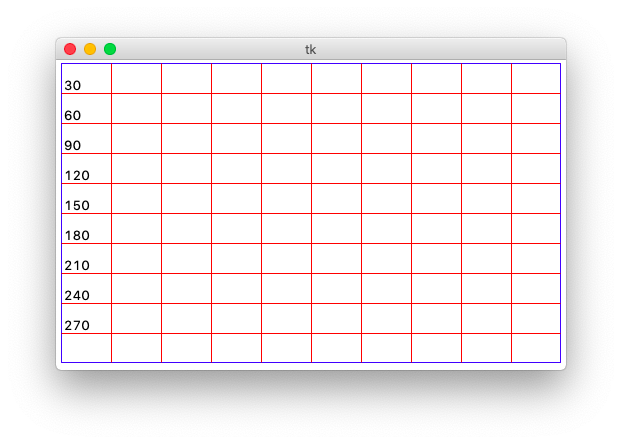
In tkinter nomenclature, we say that the anchor point for
the label is anchor=tkinter.SW, which means that the
coordinates we specify for the label are those for its SouthWest
corner.
Random Circles
Download the starter code for this problem here.
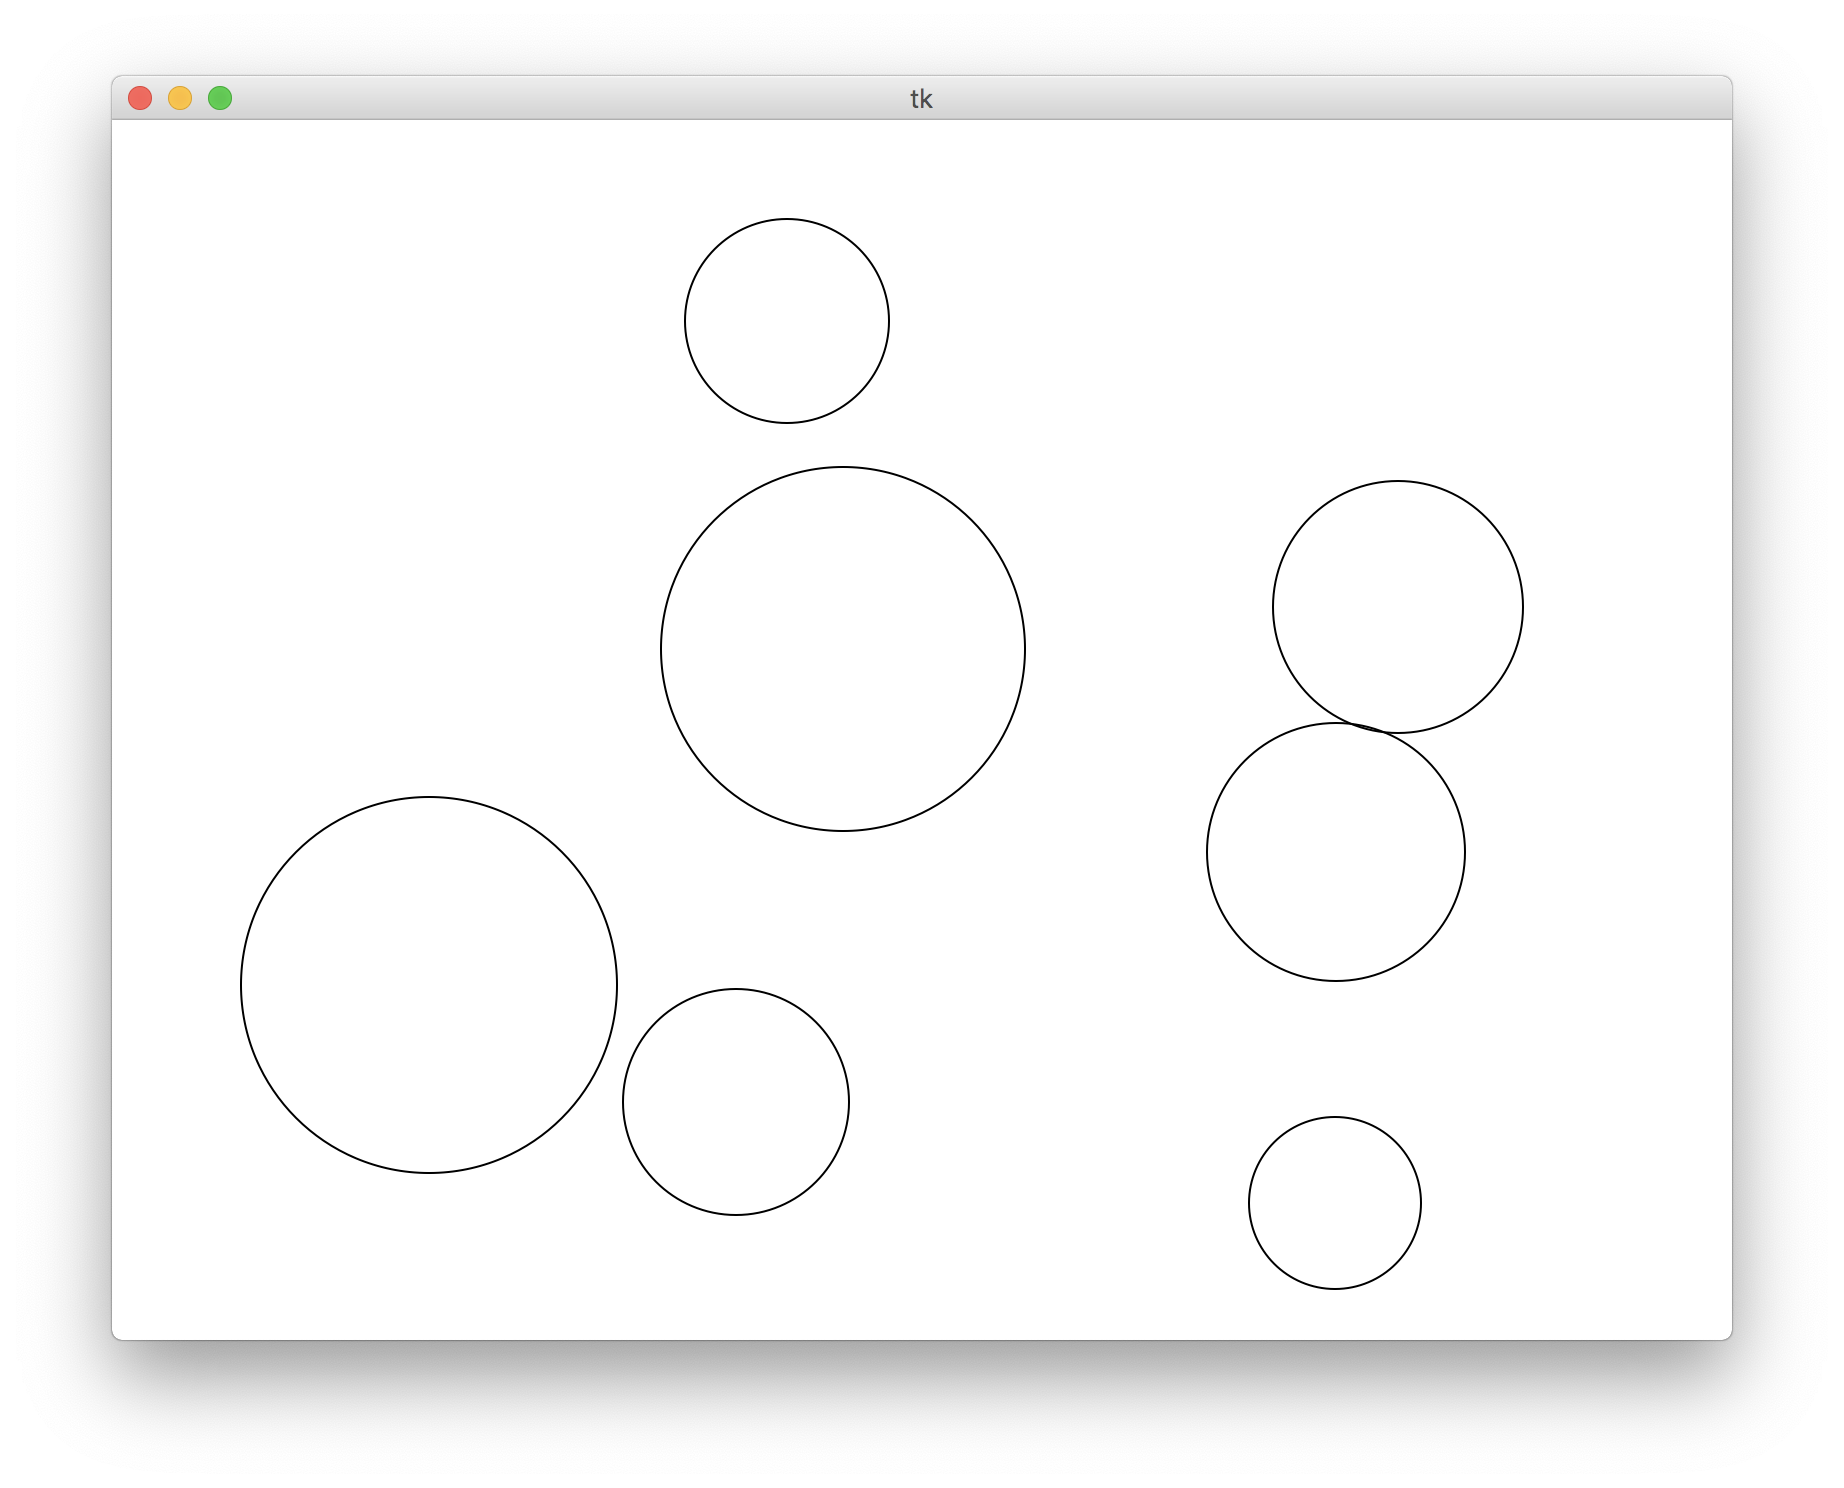
Write a program that draws a random number of circles of random sizes
at random positions on the canvas. Be careful to make sure that none
of the drawn circles are cut off by the edge of your canvas. You are
provided with the constants WIDTH and
HEIGHT (the canvas width and height, respectively),
RADIUS_MAX and RADIUS_MIN (the
maximum/minimum radius that each random circle may have), and
N_CIRCLES_MAX (the maximum number of circles that may be
generated in one run of our program. Note that each run should
generate between 1 and N_CIRCLES_MAX circles inclusive on
both ends). Specifically, your job is to implement the following
function:
def make_all_circles(canvas)
into which is passed a canvas and whose job is to do the random
drawing of the circles. You might find the following functions
helpful, some of which are found in the
random module:
# draws an oval on a canvas, the top left corner of whose bounding box
# is at (x0, y0) and the bottom right corner of whose bounding box is
# at (x1, y1)
canvas.create_oval(x0, y0, x1, y1)

# returns a random integer between lower and upper, inclusive of both
# bounds
random.randint(lower, upper)

# returns a random number between 0 and 1
random.random()
Drawing friend graphs
Python is commonly used to help analyze data sets by creating visualizations of said data. One common example of data visualization is to look at relationships between users social networks. Programmers can use python to help draw the network. The visual can be used to measure statistics of the network or to find clusters, which are groups of individuals who have many of the same friends. There are many reasons to search for close-knit groups in social networks - for instance, to create targeted marketing schemes or to suggest groups they'd like to be a part of. Cluster analysis has been also used to identify terrorist cells.
In this problem, you are going to use your python programming skills to create a visual representation of a social network where users can follow each other. More specifically, you will use information from two text files and draw lines representing the relationships in the network. If a user follows another user, your output should have a line connecting the two people.
You will be given two files through command-line arguments. The first file is a list of each person in the network, each on a separate line, where their name is followed by a colon and then a list of all the people that they follow. The second file is a list of coordinates. Each line has the name of a person in the network, followed by a colon and then a comma separated l list of two integers representing the x and y coordinates you will use to place the node representing that person on the canvas.
Your job is to write a full python program, including a
main function, that uses the information in these two
files to draw the social network. For each user: at their respective
coordinates draw a circle and a string of text with their name. Then,
draw lines connecting that circle to the circle of every person that
they follow.
As you consider how best to approach the problem and store your data, keep in mind that relationships aren't necessarily symmetric. Take, for example, the following friends file:
Juliette: Brahm, Nick, Julie, Cynthia
Brahm: Juliette, Nick, Cynthia, Mehran, Chris, Cynthia
Mehran: Oliver, Chris
Chris: Mehran, Oliver
Nick: Juliette, Julie, Keith
Julie: Juliette, Nick, Cynthia
Oliver: Mehran, Chris
Cynthia: Juliette, Julie, Keith
Keith: Nick, Cynthia
Note that Brahm follows several users, but despite his best efforts to use in-vogue hashtags, has but a single humble follower.
Download the PyCharm project for this section here. We have provided some sample data files in the project, and you can test your code like so:
python3 draw_friend_network.py friends1.txt coordList1.txt
You may assume that the two files provided are valid and represent the same users, but an interesting extension to this problem might be to verify that.
Using map
Solve each of these problems using the map function
described in lecture.
-
You and your freshman year roommate grew up in different countries. You often have trouble trying to explain the current temperature outside as one of you is familiar with degrees Celsius and the other is used to using degrees Fahrenheit. Fortunately, one of you is taking 106A and can help!
Given a list of temperatures in degrees Farenheit like so:
temps_F = [45.7, 55.3, 62.1, 75.4, 32.0, 0.0, 100.0]
Write an expression to produce a list of those same temperatures, measured in degrees Celsius. As a reminder, to convert Farenheit to Celsius, you first subtract 32 and then multiply by 5⁄9.
-
You and some friends want to see what is going on at Cal before the big game. They might be planning something suspicous. To investigate, you plan to fly a drone over the football stadium in the days leading up to the game.
Like any responsible drone pilot, you have plotted the flight path by writing down the direction, or heading, of the plane at each turn. An hour before the first takeoff, however, you realize that you didn't account for the magnetic deviation, or the local magnetic fields created by technology on the drone that mess with its internal compass reading. You also forgot to account for magnetic variation, or the difference between true north and magentic north. To account for magnetic deviation and variation, you must add 22 degrees to all of your heading calculations. Recall that the compass wraps around at 360 degrees, so any new heading calculated must also be between 0 and 359 degrees.
Along with exact headings, you have also calculated if each turn is generally towards the North, East, South or West using the following buckets:
- North: 316-45 degrees
- East: 46-135 degrees
- South: 136-225 degrees
- West: 226-316 degrees
Your job is to write an expression that given a list like so:
                original_headings = [(30, 'N'), (359, 'N'), (340, 'N'), (270,
                'W'), (124, 'E'), (149, 'S'), (219, 'S')]
Produces a new list with the updated headings and directions after correcting for magnetic variation and deviation. You may implement any helper functions you want, but your top-level expression should be one line of code.
-
The weather outside has been really beautiful lately, but when Brahm
went for his morning walk this morning, he got stung by a bee! To
take retaliation against their species, he's jumbled up the script
of the Bee Movie:
Brahm took every word in the script, and reversed it! Write an expression to fix this, returning the first few lines of the Bee Movie script, in the correct order.
s = """
gnidroccA ot lla nwonk swal fo ,noitaiva ereht si on yaw a eeb dluohs eb
elba ot .ylf stI sgniw era oot llams ot teg sti taf elttil ydob ffo eht
.dnuorg ehT ,eeb fo ,esruoc seilf yawyna esuaceb seeb t'nod erac tahw snamuh
kniht si .elbissopmi
"""
Reading map
Predict what each of the following blocks of code will do:
counting = [5, 6, 7, 8]
jenny = [8, 6, 7, 5, 3, 0]
lst = list(map(lambda lst: lst.append(9), [counting, jenny]))
counting = [5, 6, 7, 8]
jenny = [8, 6, 7, 5, 3, 0]
lst = list(map(lambda lst: lst + [9], [counting, jenny]))
Sorting with lambdas
Solve each of the following challenges in one line of Python, using
the lambda technique:
-
Given a list of strings
strs, sort the list case-insensitively (i.e. ignoring whether the word is upper or lower case) -
Given a list of strings
strs, sort the list according to the last character of each string, case-insensitively. -
Given a list of integers
nums, sort the list according to the absolute difference between each number and 3.14. Python has anabsfunction, which takes as input a number and returns its absolute value, and which you might find helpful in this problem. -
Given a list of tuples that represents houses for rent, the number
of bedrooms and their prices, like so:
                [ ('main st.', 4, 4000), ('elm st.', 1, 1200), ('pine st.', 2,
                1600)]
Sort the list in the following ways:
- In ascending order by number of rooms
- In ascending order of price
- In ascending order of price-per-room
Tweets Revisited
Recall the Big Tweets Data problem from last week, in which we worked
with a user_tags dictionary whose keys were twitter
usernames and whose values were additional nested dictionaries keeping
track of the frequencies of Hashtag usage, like so:
user_tags = {'@alice': {'#apple': 1, '#banana': 2}, '@bob': {'#apple': 1}}
One of the suggested extensions for this problem was to implement a
function called flat_counts, which takes in a
user_tags and returns a dictionary that counts the number
of times each Hashtag is used, across all users. For example, calling
flat_counts and passing the
user_tags dictionary in as a parameter would lead to the
following behaviour:
>>> flat_counts(user_tags)
{'#apple': 2, '#banana': 2}
Now, armed with your new toolkit for sorting, your job is to implement the following function:
def most_used(flat_counts)
which takes in a 'flat' dictionary as described above, and returns the
most frequently used hashtag in the dataset. With a solid
understanding of how lambdas can be used in sorting, you
should be able to solve this in just a few lines of code. As a hint,
dictionaries have a built-in items() function that
returns a list of (key, value) tuples.
Pynary Bomb
Download the starter file for this problem here.
A rogue Cal student has somehow gained access to a computer on Stanford premises and as a misguided attempt to demonstrate their technical superiority, has left an ill-intentioned program -- a 'Pynary bomb' -- for us to deal with. Left unchecked, there's no telling what this program might do: perhaps it'll delete the 106A website and all your hard work on the assignments, or perhaps it'll constantly post low-quality content to SMFET, diluting Stanford's cultural credibility.
Fortunately for us, that student underestimated both your tenacity and skill with Python, and it's up to you to save the day. Your mission, should you choose to accept it, is to trace through the student's program (reproduced below) and to figure out the set of command line arguments that 'defuse' the bomb.
We've collected some intel about the program, which we're sharing with you here:
- The author of this program is malintentioned, without question, but is not duplicitious. The functions they've written are at least good-faith efforts in implementing the behaviour their names describe, although they might not always succeeed.
- The bomb will not resist any attempts by you to make its workings more transparent, for example by printing the values of various variables throughout the program's execution.
def swap(li, idx0, idx1):
    temp = li[idx0]
    li[idx0] = li[idx1]
    li[idx1] = temp
    return idx1 - 1

def extends(d, k1, k2):
    copy = d[k1]
    copy.extend(d[k2])

def slicer(lst, val):
    lst = lst[val:]

def even_odd_counter(d):
    d_even_odd = {}
    for k in d.keys():
        for v in d[k]:
            x = v % 2
            if x not in d_even_odd:
                d_even_odd[x] = 0
            d_even_odd[x] += 1
    return d_even_odd

def foo(inp1, inp2, inp3):
    y = {'a': [1], 'b': [2,3], 'c': [4,5,6], 'd':[7,8,9,10], 'e':[11,12,13,14,15]}
    x = sorted(list(y.keys()), reverse=True) # sorts y.keys() in descending order
    idx0 = 0
    while idx0 <= inp1:
        inp1 = swap(x, 0, inp1)
    if y[x[2]] != [2,3] and x[4] != 'a':
        print("BOOM!!")
        return
    slicer(x, 2)
    extends(y, x[0], x[inp2])
    if len(y[x[0]]) != 5:
        print("BOOM!!")
        return
    d_count = even_odd_counter(y)
    if d_count[1] != inp3:
        print("BOOM!!")
        return
    print("Phew! That was a close one.")
    print("You've defeated the Pynary Bomb, congratulations!")

def main():
    args = sys.argv[1:]
    print("Good luck...")
    foo(int(args[0]), int(args[1]), int(args[2]))

if __name__ == "__main__":
    main()
Analyzing Mimic Output
Thanks to Sheridan Rea for suggesting this problem!
Introduction
One of the programs you'll have written as part of assignment 6 is called Mimic, in which you examine a piece of text and associate individual words with those that might follow them. In doing so, you gain the ability to generate new text by continuously choosing new words from the ones you previously selected.
This program involves constructing what is called a Markov Model, in which you generate new data (in this case, words), based solely on information about the last piece of data you generated. Markov Models are widely employed to solve all sorts of problems in Artificial Intelligence research. In fact, many of the most widely-used techniques in Natural Language Processing use representations of words produced from a process not unlike that which you're tasked with implementing in Assignment 6. One of the most interesting properties of such models is that they help us to construct a statistical model of Natural Language, and to consequently make predictions about it. In this problem, you'll explore the statistical properties of the model constructed in the Mimic program, using only the skills you've already developed as a Python programmer.
Getting started
Begin by downloading the starter code for this project here from the course website and importing it into PyCharm. The project comes with a few important files:
-
stats.py, in which you'll be writing code to analyze the output of the Mimic program. -
alice-book.txt, the full text of Alice in Wonderland. -
alice-sample.txt, produced by running my own Mimic solution as follows:$ python3 mimic.py alice-book.txt 1000 -
tale-of-two-cities.txt, the full text of A Tale of Two Cities. -
tale-of-two-cities-sample.txt, produced by running my own Mimic solution as follows:$ python3 mimic.py tale-of-two-cities.txt 1000
Each of the -sample.txt files are approximately 1000
words and as the assignment handout suggests, should sound like
they're in the voice of the original text. You'll verify this in this
problem!
Collecting statistics
Your goal in this problem is to write a program that analyses and
prints the frequency of words in a piece of text. You'll then use the
program to compare the distributions of word occurrences between a
piece of text and the output of the Mimic program, run on that piece
of text. We've provided some basic scaffolding for you in
stats.py, which you can run like so:
$ python3 stats.py alice-book.txt
Your job is to implement the following function:
def print_most_frequent(filename)
which takes as a parameter the name of a file and ultimately prints the words in the file in ascending order of how frequently they are used, as well as their frequency counts. We'll leave your exact decompositional strategy up to you, but your program should look fairly similar in structure to the Mimic assignment itself.
Analyzing the Output
Once you've got the print_most_frequent function (and by
extension the stats.py program) up and running, it's time
to use it to examine the frequency distributions of the words in
various files. For example, run
python3 stats.py alice-book.txt and
python3 stats.py alice-sample.txt and compare the
outputs. Do the two files use the same words the most frequently? If
not, what might be causing that difference? Is the same true for
A Tale of Two Cities?
Words of Wisdom
While we'll leave the actual strategy of decomposition and other implementation details largely up to you, here are a few directions you could take, some of which I employed in my own solution:
-
When reading through a file, you can use the
f.read()function to read the entire text of the file as a string and thes.split()function to split that string into a list of space-separated tokens. - Somehow standardizing the case of the words will allow you to produce better distributions of word usage.
- Some words might also end with punctuation marks like full stops, exclamation marks, question marks, and semicolons. To deal with this this, you might want to detect and remove any punctuation at the end of a word.
-
Given a dictionary of word counts, you can get a sortable list of
key-value tuples like so:
word_count_pairs = list(counts.items()) - The texts in question have many different words, most of do not occur very frequently. When printing out the words and their counts in the text, consider only doing so for words that only occur above some fixed amount of times to reduce the number of words printed.
Moving On
While you were hopefully able to gain some insights into the language model that the Mimic program constructs, there's plenty you can do to continue to explore this, if you so choose:
-
Trying on different texts Try using Mimic to produce samples
of essays or blog posts you've written, or on other pieces of famous
literature, or if you're feeling really wild, pieces of Python code.
On the ones that it doesn't work well on, inspect the distributions
using
stats.pyto see how they're different. To save the output of Mimic to a text file, run it like so:$ python3 mimic.py <textfile> <limit> > <filename>.txt<filename>.txt. - The approach that Mimic takes to modelling a piece of text is a reasonable one, but suffers from a few limitations, as you might be able to tell from the nonsensical text it produces. Can you think of any? What could you do to fix it?