Today: mod, Canvas drawing, draw functions, drawing a grid
How much math do you need for CS? Today we'll have some really nice applied math. Mostly just addition and multiplication, but using variables like i and width in the code, and you need to form a mental model of how those numbers and formulas map to what you see on screen.
It will be tricky at times, but you will be able to see how variables and formulas in python map to real results on screen.
%The "modulo" or "mod" operator % is essentially the remainder after division. So (23 % 10)yields 3 — divide 23 by 10 and 3 is the leftover remainder. Modulo makes the most sense with positive numbers, so avoid negative numbers in modulo arithmetic.
>>> 23 % 10
3
>>> 36 % 10
6
>>> 43 % 10
3
>>> 15 % 0
ZeroDivisionError: integer division or modulo by zero
>>>
>>>  40 % 10  # mod result 0 = divides evenly
0
>>> 17 % 5
2
>>> 15 % 5
0
A simple use of modulus is checking if a number is even or odd - n % 2 is 0 if even, 1 if odd.
>>> 8 % 2
0
>>> 9 % 2
1
>>> 10 % 2
0
This is a big example program that draws on screen for today. Expand the .zip to get a "draw1" folder with .py files in it. Run PyCharm. Use Open... menu to open the *folder*
We'll use the CS106A "DrawCanvas" which supports these functions:
    def draw_line(x1, y1, x2, y2):
        """
        Draws a black line between points x1,y1 and x2,y2
        Optional color='red' parameter can specify a color.
        """

    def draw_rect(x, y, width, height):
        """
        Draws a 1 pixel rectangle frame with its upper left at x,y
        and covering width, height pixels.
        Takes optional color='red' parameter.
        """

    def fill_rect(x, y, width, height):
        """
        Draws a solid black rectangle with its upper left at x,y
        and covering width, height pixels.
        Takes optional color='red' parameter.
        """

    def draw_oval(x, y, width, height):
        """
        Draws a 1 pixel oval frame with its upper left bounding rect at x,y
        and covering width, height pixels.
        Takes optional color='red' parameter.
        """

    def fill_oval(x, y, width, height):
        """
        Draws a solid black oval with its upper left bounding rect at x,y
        and covering width, height pixels.
        Takes optional color='red' parameter.
        """

    def draw_string(x, y, text):
        """
        Draws a black text string with its upper left at x,y
        Takes optional color='red' parameter.
        """
These are noun.verb functions on a Canvas like this:
# Create a 500x300 canvas, draw a red line on it
canvas = DrawCanvas(500, 300)
canvas.draw_line(0, 0, 100, 100, color='red')
...
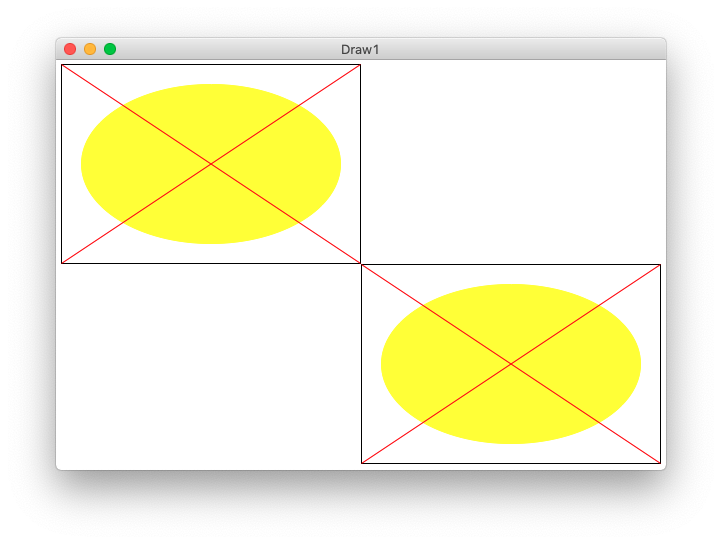
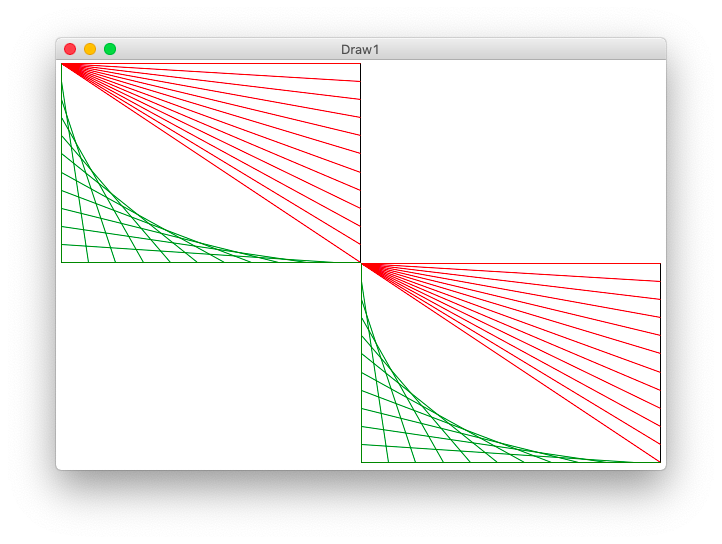
The "oval" figure has a black rectangle at its outer boundary. Then a yellow oval inset by 20 pixels on 4 sides. Then 2 red lines making a big X from upper-left to lower-right, and upper-right to lower-left. We'll use this as a first example to think about coordinates.
Running the program draws 2 copies of the figure - one upper-left, one lower-right, which helps with testing. Here is the output of the program, showing the upper-left and lower-right copies of the figure. Each figure is drawn by one call to the draw_oval() function below.
The draw_oval() functions draws one copy of the figure on the canvas. The size and position of the figure is determined by the parameters passed into draw_oval() - the figure is positioned at the given left,top parameters, with its size given by width,height parameters.
Q1: What is the x,y position of the inset oval?
Q2: What is the width,height size of the inset oval?

A1: left,top are the coords of the figure itself. The coords of the inset oval are
left + 20, top + 20
A2: The width of the inset oval is (width - 40), since the oval loses 20 pixels on its left side, and also 20 pixels on its right side. Likewise its height is(height - 40)
Here is the line of python code to draw that oval by calling the fill_oval() function, doing the math to specify the location and size of the inset oval.
def draw_oval(canvas, left, top, width, height):
    ...
    canvas.fill_oval(left + 20, top + 20, width - 40, height - 40,
      color='yellow')
Q1: What is the coordinate of the upper-left corner pixel of the figure? It's not (0,0), that's the coordinate of the upper left corner of the whole screen. The coordinate of the upper left of the figure is
`left, top`
We'll use some real numbers to think about this math, say left, top is 100,50. Say width,height is 100, 50.

This is a little tricky.
Q2: What is the coordinate of the upper-right corner pixel of the figure?
Q3: What is the coordinate of the lower-right corner pixel of the figure?
Above is too tricky: Strategy put in real numbers and a tiny width, say width is 5. Then we can count the pixels over to the corner to see the math. Here is the drawing for that. What are coordinates with width=5. Then try to figure out the general formula. This is a funny juxtaposition - look at with a dinky number like 5, then work out the general formula that works for infinite cases.


Here are the lines which draw the 2 red lines in, just using the corner coordinates worked out above.
def draw_oval(canvas, left, top, width, height):
    ...
    # Draw red lines
    # upper-left to lower-right
    canvas.draw_line(left, top, left + width - 1, top + height - 1, color='red')

    # lower-left to upper-right
    canvas.draw_line(left, top + height - 1, left + width - 1, top, color='red')
-oval 500 300The main() in this case with args like -oval 500 300 calls draw_oval() twice, once upper left and once lower right. This tests that the left,top are handled correctly. Open the "terminal" at the lower left of PyCharm. The "$" below is the prompt, the rest you type (on Windows its "python" or "py" instead of "python3".) Close the drawing window when done, this exits the draw program.
$ python3 draw1.py -oval 300 200
In the terminal, hit the up arrow. Edit the old command and run it again easily. This is a very productive and fast way to run and vary your program.
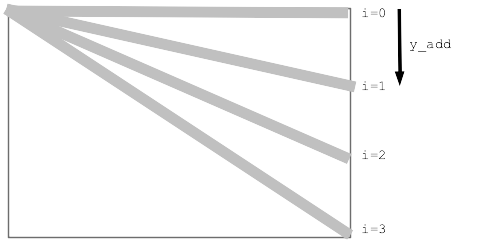
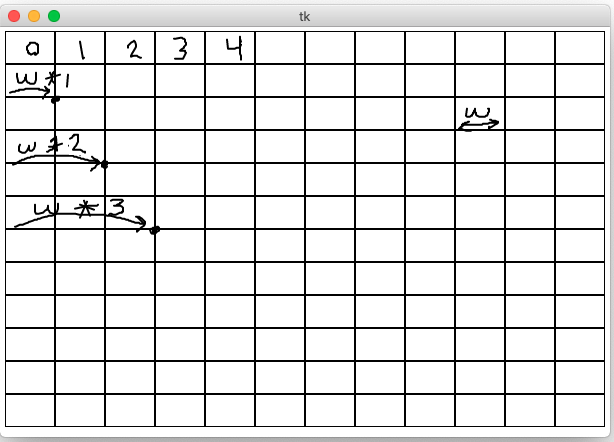
for i in range(n):
    y_add = (i / (n - 1)) * (height - 1)
Say n=4
Fraction = i/(n-1)
Max = (height - 1)
y_add = fraction * (height - 1)

i   fraction
0   0/3  y_add = 0.0  * (height - 1)
1   1/3  y_add = 0.33 * (height - 1)
2   2/3  y_add = 0.66 * (height - 1)
3   3/3  y_add = 1.0  * (height - 1)
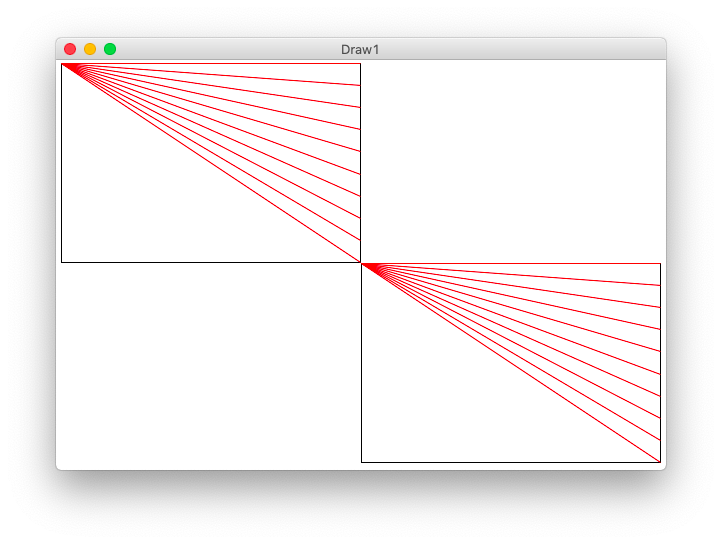
Here is the formula at work to draw the red lines.
def draw_lines1(canvas, left, top, width, height, n):
    """
    Draw the lines1 figure within left,top .. width,height
    (this code is complete)
    """
    canvas.draw_rect(left, top, width, height)
    # Figure y_add for each i in the loop
    for i in range(n):
        y_add = (i / (n - 1)) * (height - 1)  # formula: fraction * max
        canvas.draw_line(left, top, left + width - 1, top + y_add, color='red')
-lines 300 200 12Run from command line
$ python3 draw1.py -lines1 300 200 12
What if we wanted to draw the lines alternating red, green, red, green...
A common way to do this is use modulus - look at the value of i % 2 in the loop. It will be either 0 or 1 alternating. (Modulus result is always 0..n-1). If it's 0 draw red, otherwise draw green.
draw_lines1() with alternating color:
    for i in range(n):
        y_add = (i / (n - 1)) * (height - 1)  # formula: fraction * max
        if i % 2 == 0:
            canvas.draw_line(left, top, left + width - 1, top + y_add, color='red')
        else:
            canvas.draw_line(left, top, left + width - 1, top + y_add, color='green')
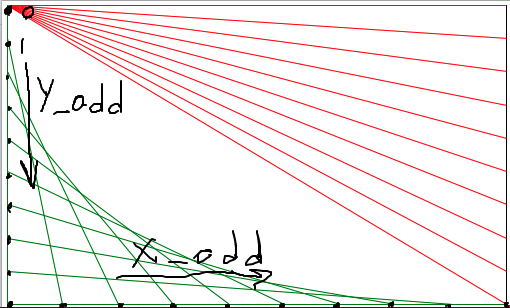
Look at the drawing to work out the x1,y1 x2,y2 to draw the green line. Demo-note: try to have the drawing visible while working out the code for this.
    # loop to draw green "lines2" lines
    for i in range(n):
        y_add = (i / (n - 1)) * (height - 1)
        x_add = (i / (n - 1)) * (width - 1)
        pass
        # Your code here - draw each green line
Run from the command line:
$ python3 draw1.py -lines2 300 200 12
        ...
        # Your code here - draw each green line
        canvas.draw_line(left, top + y_add, left + x_add, top + height - 1, color='green')
>>> 500 / 11
45.45454545454545    # float division with fraction
>>> 500 // 11        # int division - what we want here
45
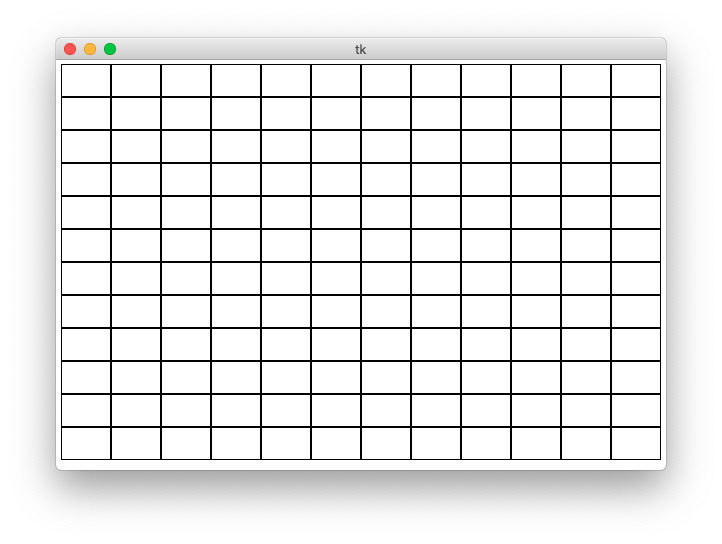
def draw_grid1(width, height, n):
    """
    Creates a canvas.
    Draws a grid1 of n-by-n black rectangles
    (this code is complete)
    """
    canvas = DrawCanvas(width, height, title='Draw1')

    # Figure sizes for all sub rects
    sub_width = width // n
    sub_height = height // n

    # Loop over row/col
    for row in range(n):
        for col in range(n):
            # Figure upper left of this sub rect
            left = col * sub_width
            top = row * sub_height
            canvas.draw_rect(left, top, sub_width, sub_height)
Run from command line:
$ python3 draw1.py -grid1 600 400 12
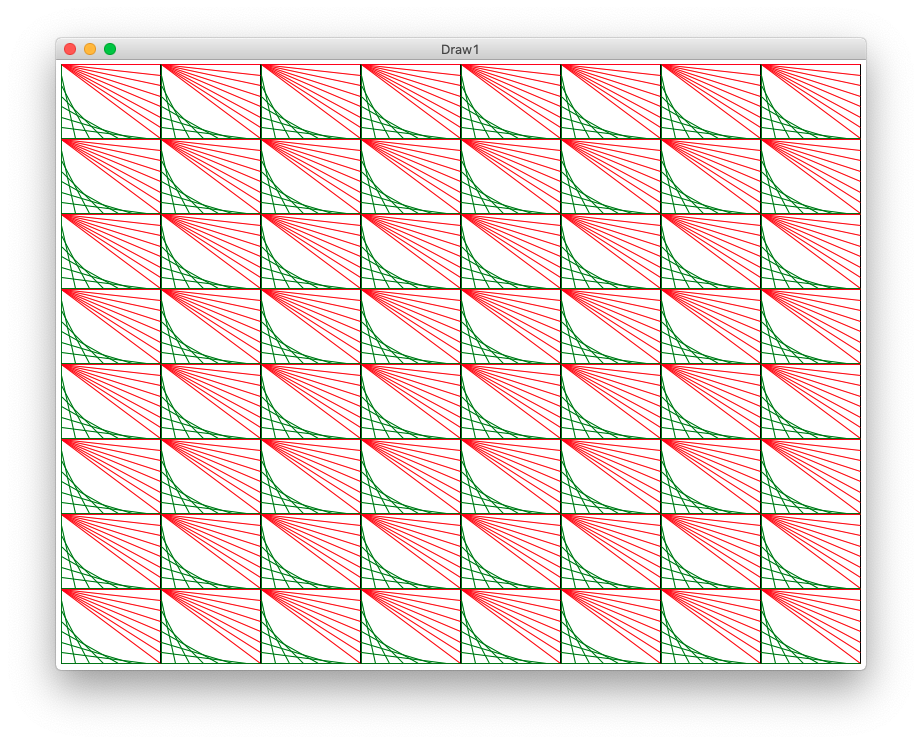
Change the code to fill a rect inside the grid1 loop, or draw a filled oval of some color. Whatever function call we put inside the loop, we get n * n copies of whatever that function draws.
            ...
            left = col * sub_width
            top = row * sub_height
            canvas.fill_oval(left, top, sub_width, sub_height, color='yellow')
Here is the draw_lines2() def first line:
def draw_lines2(canvas, left, top, width, height, n):
    """
    Draw the lines2 figure within left,top .. width,height
    The code for lines1 is already here
    """
def draw_grid2(width, height, n):
    """
    Creates a canvas.
    Add code to draw the lines2 figure in each grid sub rect.
    """
    canvas = DrawCanvas(width, height, title='Draw1')

    sub_width = width // n
    sub_height = height // n

    for row in range(n):
        for col in range(n):
            # Your code here - draw a lines2 figure in each grid rect
            pass
            left = col * sub_width
            top = row * sub_height
            # Key line: call function to do it,
            # passing in left,top,width,height,n we want
            draw_lines2(canvas, left, top, sub_width, sub_height, n)
Looks neat - loops + function-call = power!