Today: function call parameter recap, Canvas drawing, draw functions, drawing a grid
Now we're going to do something different - drawing lines and rectangles and whatnot on screen. This is a realistic thing many programs need to do. It's also a neat way to experiment with math in your code with visual results.
How much math do you need for CS? Today we'll have some really nice applied math. Mostly just addition and multiplication, but using variables like i and width in the code, and you need to form a mental model of how those numbers and formulas map to what you see on screen.
It will be tricky at times, but you will be able to see how variables and formulas in python map to real results on screen.
We are going to lean on parameters very hard for today's example, here is a quick recap.
Say we have a foo a def with left and top parameters. Each parameter is a value coming in. Just use left and top in the code, knowing the right value is in there.
def foo(left, top):
Where does the parameter value come from? From the call - some line called this function for it to run, and the parameter values to use are written within the parenthesis, matching up by position.
    ...
    foo(100, 50)
    ...
Here left will be 100 and top will be 50.
This is a big example program that draws on screen for today. Expand the .zip to get a "draw1" folder with .py files in it. Run PyCharm. Use Open... menu to open the *folder*
We'll demonstrate the drawing functions one by one below. For more details there is also a Draw Reference page.
Here is a list of all the canvas draw functions, which have similar parameters to fill_oval().
    def draw_line(x1, y1, x2, y2):
        """
        Draws a black line between points x1,y1 and x2,y2
        Optional color='red' parameter can specify a color.
        """

    def draw_rect(x, y, width, height):
        """
        Draws a 1 pixel rectangle frame with its upper left at x,y
        and covering width, height pixels.
        Takes optional color='red' parameter.
        """

    def fill_rect(x, y, width, height):
        """
        Draws a solid black rectangle with its upper left at x,y
        and covering width, height pixels.
        Takes optional color='red' parameter.
        """

    def draw_oval(x, y, width, height):
        """
        Draws a 1 pixel oval frame with its upper left bounding rect at x,y
        and covering width, height pixels.
        Takes optional color='red' parameter.
        """

    def fill_oval(x, y, width, height):
        """
        Draws a solid black oval with its upper left bounding rect at x,y
        and covering width, height pixels.
        Takes optional color='red' parameter.
        """

    def draw_string(x, y, text):
        """
        Draws a black text string with its upper left at x,y
        Takes optional color='red' parameter.
        """
Here is the fill_oval() function specification - a representative example. The parameters x, y are the coordinate of the upper-left corner of a theoretical rectangle enclosing the oval. The oval is drawn to be width, height pixels in size.
    def fill_oval(x, y, width, height):
        """
        Draws a solid black oval with its upper left
        bounding rect at x,y
        and covering width, height pixels.
        Takes optional color='red' parameter.
        """
First create the canvas of the desired size - it's a white rectangle to start. Then call fill_oval() etc. to draw on it.
# Create a 500x300 canvas
canvas = DrawCanvas(500, 300)

# Draw a blue oval with upper left at x 100, y 50
# width 60, height 40
canvas.fill_oval(100, 50, 60, 40, color='blue')
...
We have used int indexes constantly to address chars in a string and individual pixels in an image. But not today! Float values work fine with the canvas draw functions. We can just use float values and in particular / division, and it will work perfectly. The drawing system can cope with a coordinate like x = 50.8. Internally it just drops the fractional part - e.g.50.8 just truncates to 50 to draw on screen, and you cannot see the difference.
canvas.fill_oval(50.8, 20, 100.3, 150.9)
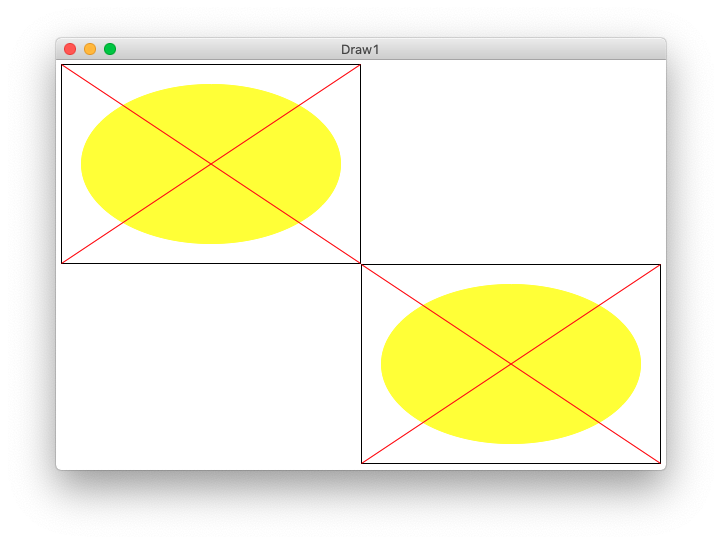
We'll start with the "oval" figure - it has a black rectangle at its outer boundary. Then a yellow oval inset by 20 pixels on 4 sides. Then 2 red lines making a big X from upper-left to lower-right, and upper-right to lower-left. We'll use this as a first example to practice coordinate code.
Running the program draws 2 copies of the figure - one upper-left, one lower-right, which helps with testing. Here is the output of the program, showing the upper-left and lower-right copies of the figure. Each figure is drawn by one call to the draw_oval() function below.
Running from the command line looks like this:
$ python3 draw1.py -oval 500 300
draw_oval(canvas, left, top, width, height):The draw_oval() functions draws one copy of the figure on the canvas. The size and position of the figure is determined by the parameters passed into draw_oval() - the figure is positioned at the given left,top parameters, with its size given by width,height parameters.
Q1: What is the x,y of the upper left pixel of the imaginary rectangle around the inset oval?
Q2: What is the width,height size of the inset oval?

A1: left,top are the coords of the figure itself. The coords of the inset oval are
left + 20, top + 20
A2: The width of the inset oval is (width - 40), since the oval loses 20 pixels on its left side, and also 20 pixels on its right side. Likewise its height is(height - 40)

Here is the line of python code to draw that oval by calling the fill_oval() function, doing the math to specify the location and size of the inset oval.
def draw_oval(canvas, left, top, width, height):
    ...
    canvas.fill_oval(left + 20, top + 20,     # x, y
                     width - 40, height - 40, # w, h
                     color='yellow')
What is that code saying? The parameter left holds the x value for the overall figure. The code can pass the expression left + 20 as the x value for the inset oval.
This is classic parameter-using code - we do not know exactly what number we are running with. But writing the code, we just use the parameters, trusting that the right value is in there.
Note: also this shows a PEP8 style approved way to call a function with a lot of parameters, the second and later lines are indented to match the first. Just writing it all on one line is fine too.
Q1: What is the coordinate of the upper-left corner pixel of the figure? It's not (0,0), that's the coordinate of the upper left corner of the whole screen. The coordinate of the upper left of the figure is: left, top
We'll use some real numbers to think about this math, say left,top is 100,50. Say width, height is also 100,50. Try the following questions.

This is a little tricky.
Q2: What are the coordinates of the upper-right corner pixel of the figure?
Q3: What are the coordinates of the lower-right corner pixel of the figure?
Above is too tricky: Strategy put in real numbers and a tiny width, say width is 5. Then we can count the pixels over to the corner to see the math. Here is the drawing for that. What are coordinates with width=5. Then try to figure out the general formula. This is a funny juxtaposition - look at with a dinky number like 5, then work out the general formula that works for infinite cases.

With width 5, the rightmost pixel is at 104. In general, the pattern is left + width - 1. It's the same pattern in the vertical direction, bottom pixel is top + height - 1

Here are the lines which draw the 2 red lines in, just using the corner coordinates worked out above.
def draw_oval(canvas, left, top, width, height):
    ...
    # Draw red lines
    # upper-left to lower-right
    canvas.draw_line(left,
                     top,
                     left + width - 1,
                     top + height - 1,
                     color='red')

    # lower-left to upper-right
    canvas.draw_line(left, top + height - 1, left + width - 1, top, color='red')
Note: the first draw_line() shows one PEP8 style approved way to call a function with a lot of parameters, the second and later lines are indented to match the first. Just writing it all on one line is fine too, a shown with the second call.
-oval 500 300The main() in this case with args like -oval 500 300 calls draw_oval() twice, once upper left and once lower right. This tests that the left,top are handled correctly. Open the "terminal" at the lower left of PyCharm. The "$" below is the prompt, the rest you type (on Windows its "python" or "py" instead of "python3".) Close the drawing window when done, this exits the draw program.
$ python3 draw1.py -oval 300 200
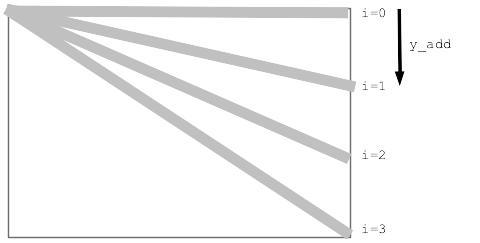
i is:      0    1     2     3
want frac: 0.0  0.33  0.66  1.0
for i in range(n):
    y_add = (i / (n - 1)) * (height - 1)
    # call draw_line() using y_add
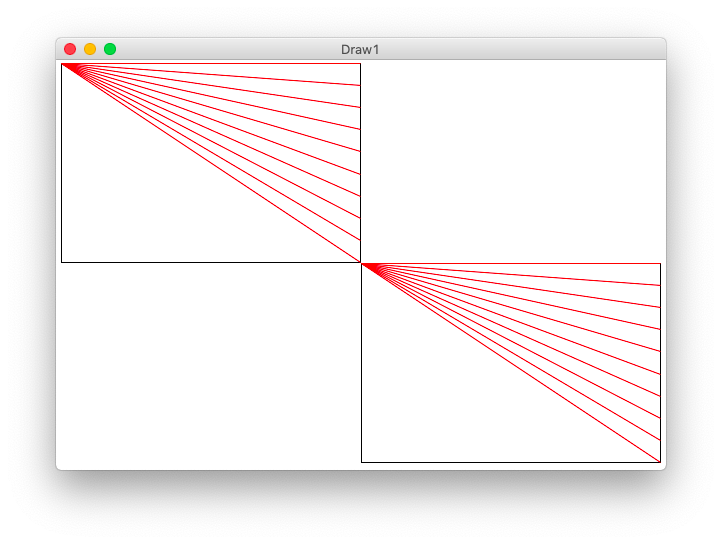
Here is the y_add pattern at work to draw n red lines from the upper left corner, all to a series of points running down the right side.
def draw_lines1(canvas, left, top, width, height, n):
    """
    Draw the lines1 figure within left,top .. width,height
    (this code is complete)
    """
    canvas.draw_rect(left, top, width, height)
    # Figure y_add for each i in the loop
    for i in range(n):
        y_add = (i / (n - 1)) * (height - 1)  # formula: fraction * max
        canvas.draw_line(left, top, left + width - 1, top + y_add, color='red')
This command line will call the draw_lines1() function.
$ python3 draw1.py -lines1 300 200 12
What if we wanted to draw the lines alternating red, green, red, green...
A common way to do this is use modulus - look at the value of i % 2 in the loop. It will be either 0 or 1 alternating. (Modulus result is always 0..n-1). If it's 0 draw red, otherwise draw green.
draw_lines1() with alternating color:
    for i in range(n):
        y_add = (i / (n - 1)) * (height - 1)  # formula: fraction * max
        if i % 2 == 0:
            canvas.draw_line(left, top, left + width - 1, top + y_add, color='red')
        else:
            canvas.draw_line(left, top, left + width - 1, top + y_add, color='green')
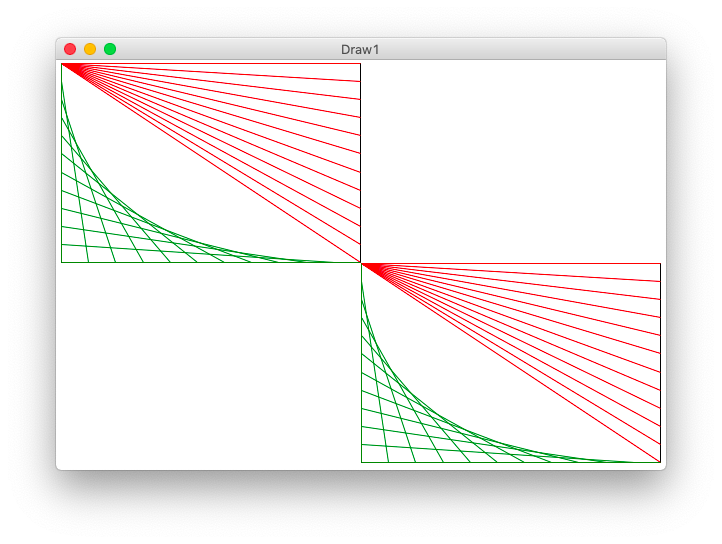
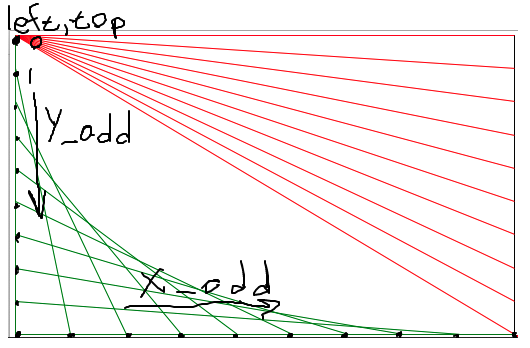
Look at the drawing to work out the x1,y1 x2,y2 to draw the green line. Demo-note: try to have the drawing visible while working out the code for this.
    # loop to draw green "lines2" lines
    for i in range(n):
        y_add = (i / (n - 1)) * (height - 1)
        x_add = (i / (n - 1)) * (width - 1)
        pass
        # Your code here - draw each green line
Run from the command line:
$ python3 draw1.py -lines2 300 200 12
       ...
       # Your code here - draw each green line
       canvas.draw_line(left, top + y_add,
                        left + x_add, top + height - 1,
                        color='green')
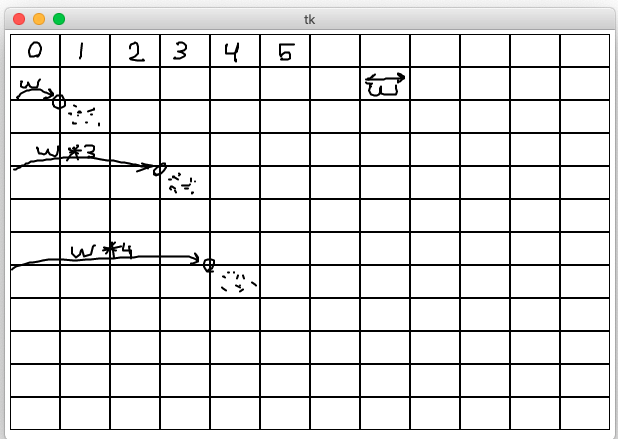
>>> 500 / 11
45.45454545454545    # float division with fraction
>>> 500 // 11        # int division - what we want here
45
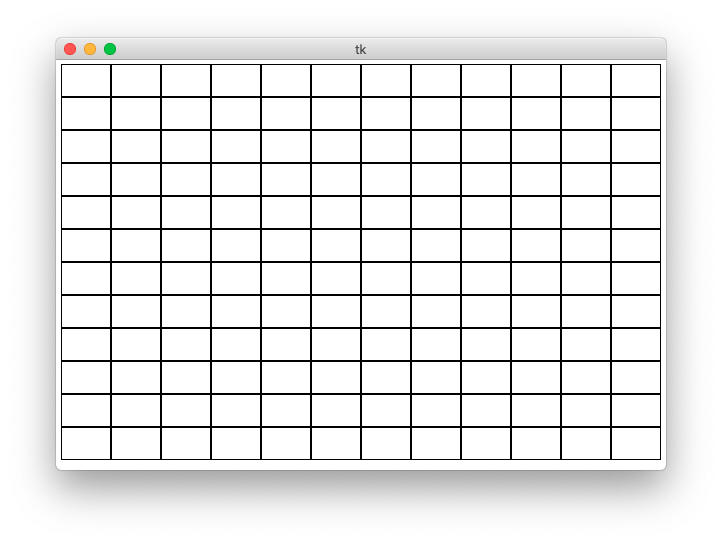
Say "w" is the sub_width of one little rect. What is the x value of the left side of a column?
def draw_grid1(width, height, n):
    """
    Creates a canvas.
    Draws a grid1 of n-by-n black rectangles
    (this code is complete)
    """
    canvas = DrawCanvas(width, height, title='Draw1')

    # Figure sizes for all sub rects
    sub_width = width // n
    sub_height = height // n

    # Loop over row/col
    for row in range(n):
        for col in range(n):
            # Figure upper left of this sub rect
            left = col * sub_width
            top = row * sub_height
            canvas.draw_rect(left, top,
                             sub_width, sub_height)
Run from command line:
$ python3 draw1.py -grid1 600 400 12
Change the code to draw a filled oval of some color for each sub-rect. Whatever function call we put inside the loop, we get n * n copies of whatever that function draws.
            ...
            left = col * sub_width
            top = row * sub_height
            canvas.fill_oval(left, top,
                             sub_width, sub_height, color='yellow')
Now we'll make a big jump.
Here is the draw_lines2() def first line:
def draw_lines2(canvas, left, top, width, height, n):
    """
    Draw lines2 figure within left,top .. width,height
    The code for lines1 is already here
    """
def draw_grid2(width, height, n):
"""
Creates a canvas.
Add code to draw the lines2 figure in each grid sub rect.
"""
canvas = DrawCanvas(width, height, title='Draw1')
sub_width = width // n
sub_height = height // n
for row in range(n):
for col in range(n):
# Your code here - draw a lines2 figure in each grid rect
pass
left = col * sub_width
top = row * sub_height
# Key line: call function to do it,
# passing in left,top,width,height,n we want
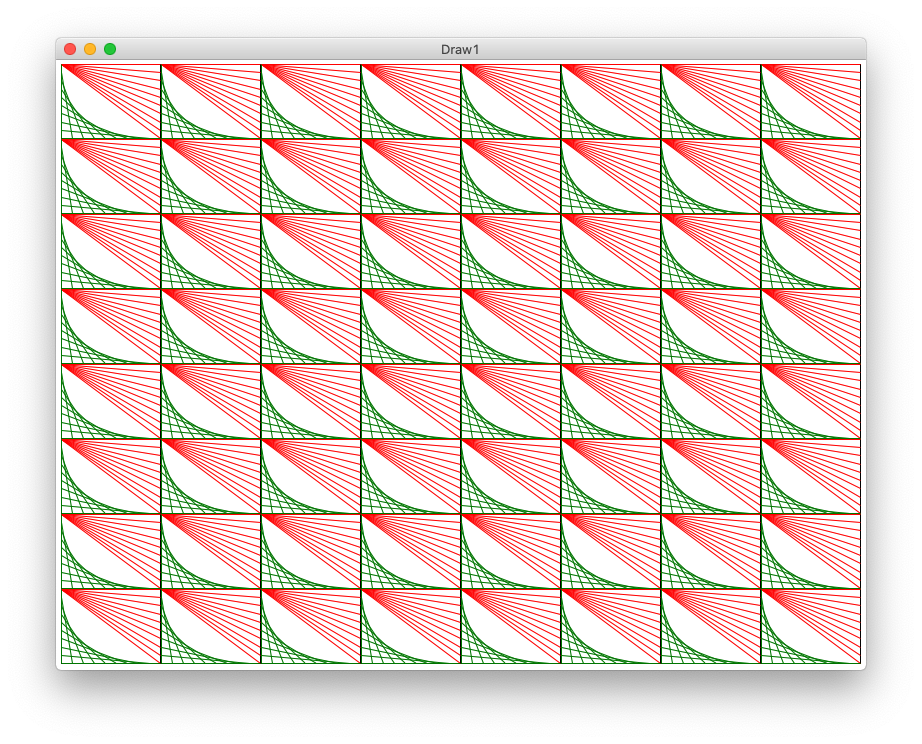
draw_lines2(canvas, left, top, sub_width, sub_height, 10)
Looks neat - loops + function-call = power!