Today: canvas drawing, draw functions, drawing a grid
Today it's like we're going through a door into a different and colorful world — drawing lines and rectangles and whatnot on screen using 2d floating point coordinate math. This is a realistic thing many programs need to do. If someday you are writing, say, iOS app, it will involve math and functions like this. It's also a neat way to experiment with math in your code with visual results.
How much math do you need for CS? Today we'll have some really nice applied math. Mostly just addition and multiplication, but using variables like i and width in the code, and you need to form a mental model of how those numbers and formulas map to what you see on screen.
It will be tricky at times, but you will be able to see how variables and formulas in python map to real results on screen.
For strings and get_pixel() and the grid it was int for everything. Now with drawing lines and ovals and whatnot, we can feed float values into the functions, and it works perfectly. This is a real change.
canvas.draw_line(50.8, 20, 100.3, 150.9)
We're about to see functions to draw things like lines rectangles on a computer canvas. Float values work consistently with these functions. The drawing system can cope with a coordinate like x = 50.8. Internally it has a rounding scheme, so for example a line can extend to x = 50.8, and another line begins at x = 51.8, and a little visual gap will appear between the two.
We can just use float values such as multiplying by 0.33 or using / division, and the drawing functions will work with the resulting float values perfectly.
This is a big example program that draws on screen for today. Expand the .zip to get a "draw1" folder with .py files in it. Run PyCharm. Use Open... menu to open the *folder*
We'll demonstrate the drawing functions one by one below. For more details there is also a Draw Reference page.
Functions to draw rectangles, ovals, lines, and strings. Here are some representative examples. Each takes an optional color='red' parameter, otherwise drawing in black.
draw_rect(x, y, width, height) - draws 4-sided frame at outside edge of rectangle
fill_rect(x, y, width, height) - fills the whole rectangle
draw_line(x1, y1, x2, y2) - draws a line from x1, y1 to x2, y2
Here is a list of all the canvas draw functions, which have similar parameters to fill_oval(). For more details there is also a Draw Reference page.
    def draw_line(x1, y1, x2, y2):
        """
        Draws a black line between points x1,y1 and x2,y2
        Optional color='red' parameter can specify a color.
        """

    def draw_rect(x, y, width, height):
        """
        Draws a 1 pixel rectangle frame with its upper left at x,y
        and covering width, height pixels.
        Takes optional color='red' parameter.
        """

    def fill_rect(x, y, width, height):
        """
        Draws a solid black rectangle with its upper left at x,y
        and covering width, height pixels.
        Takes optional color='red' parameter.
        """

    def draw_oval(x, y, width, height):
        """
        Draws a 1 pixel oval frame with its upper left bounding rect at x,y
        and covering width, height pixels.
        Takes optional color='red' parameter.
        """

    def fill_oval(x, y, width, height):
        """
        Draws a solid black oval with its upper left bounding rect at x,y
        and covering width, height pixels.
        Takes optional color='red' parameter.
        """

    def draw_string(x, y, text):
        """
        Draws a black text string with its upper left at x,y
        Takes optional color='red' parameter.
        """
fill_oval(x, y, width, height)Here is the fill_oval() function specification - a representative example. The parameters x, y are the coordinate of the upper-left corner of a theoretical rectangle enclosing the oval. The oval is drawn to be width, height pixels in size. The optional color parameter can specify a color other than black.
    def fill_oval(x, y, width, height):
        """
        Draws a solid black oval with its upper left
        bounding rect at x,y
        and covering width, height pixels.
        Takes optional color='red' parameter.
        """
Here is a very simple example we'll run. It creates a 500 by 300 white canvas. Then draws a filled blue oval on it. The blue oval's top left is at 100,50. It is 200 pixels wide and 50 height. Here is the code:
canvas = DrawCanvas(500, 300)
canvas.fill_oval(100, 50, 200, 50, color='blue')

# Create 500 by 300 canvas
# Draw filled blue oval on it at 100,50
The result looks like this:

The color='blue' syntax is an optional, named parameter passed in to the function call. Sometimes, functions take optional, extra parameters like this. In this case, the default drawing is in black, or color=xxx can specify another color.
If you want to run this case, the command line is shown below. Close the window to exit the program.
$ python3 draw1.py -first 600 400
For our examples, we'll have a "patch" or "figure" which is a little drawing that can be made on screen. We'll have a function that draws that patch, taking in the location and size for the patch as parameters. Then if we call that function 3 times, we'll get 3 copies of the patch on the screen.
e.g. We'll look at the "redx" patch below and the draw_redx() function which draws it.
draw_redx()Example 1 is the "redx" patch drawn by the draw_redx() function, and we'll look at its code below.
The redx patch has a black rectangle at its outer boundary. Then a yellow oval inset by 20 pixels on 4 sides. Then 2 red lines making a big red X from upper-left to lower-right, and upper-right to lower-left. We'll use this as a first example to practice coordinate code.
Running from the command line looks like this.
$ python3 draw1.py -redx 600 400
The main() functions calls the draw_redx() function twice to make two copies of the figure - one upper-left, one lower-right. Having two copies helps with testing. Here is the output of the program showing the two figures.

draw_redx() - Parametersdraw_redx(canvas, left, top, width, height):
The draw_redx() function draws one copy of the figure on the canvas. The size and position of the figure is determined by the parameters passed into draw_redx() - the figure is positioned at the given left,top parameters, with its size given by width,height parameters.

Have parameters left, top, width, height of the whole patch. The oval is inset by 20 pixels on all 4 sides from the rectangle.
Q1 What is the x,y of the upper left pixel of the imaginary rectangle around the inset oval?
Q2: What is the width,height size of the inset oval?
A1: left,top are the coords of the upper left corner of the figure itself and we position things inside the figure relative to that corner. Relativity - like Einstein. The coords of the inset oval are
left + 20, top + 20
A2: The width of the inset oval is (width - 40), since the oval loses 20 pixels on its left side, and also 20 pixels on its right side. Likewise its height is(height - 40)

Here is the line of python code to draw that oval by calling the fill_oval() function, doing the math to specify the location and size of the inset oval.
def draw_redx(canvas, left, top, width, height):
    ...
    canvas.fill_oval(left + 20, top + 20,     # x, y
                     width - 40, height - 40, # w, h
                     color='yellow')
What is that code saying? The parameter left holds the x value for the overall figure. The code can pass the expression left + 20 as the x value for the inset oval.
This is classic parameter-using code - we do not know exactly what number we are running with. But writing the code, we just use the parameters such as left, trusting that the right value is in there.
Note: also this shows a PEP8 style approved way to call a function with a lot of parameters, the second and later lines are indented to match the first. Just writing it all on one line is fine too.
Diagrams for the most common drawing/arithmetic situations.
Say we have a rectangle with its upper left corner at (left, top) as usual. The coordinates of its left and top edges are pretty easy — the x values for the pixels at the left edge are just: left. The y values for the pixels at the top edge are just: top
leftmost x = left
topmost  y = top

The rectangle with its left edge at left and a given width — what is the x value of its rightmost pixels, aka its right edge?

x = 99This is just zero based indexing. Wdith of 100, means x ranges 0..99.

x = (width - 1)If the rectangle is at the left edge of the canvas, then it's simply (width - 1)

x = left + (width - 1)If the rectangle is draw at left within the canvas, then the right edge is left + (width - 1)

Consider a rectangle at left, top of size width, height:
rightmost x = left + (width - 1)bottommost y = top + (height - 1)
We want to draw a red line from the upper left corner to the lower right.
What is the coordinate of the upper-left corner pixel of the patch? It's not (0,0), that's the coordinate of the upper left corner of the whole screen. The coordinate of the upper left of the figure is: left, top
We'll use some real numbers to think about this math, say left,top is 100,50. Say width, height is also 100,50. Try the following questions.

What are the coordinates of the upper-right corner pixel of the figure?
What are the coordinates of the lower-right corner pixel of the figure?
left + width - 1Recall from decoder, right edge x is left + width - 1. Therefore:
upper right
  x = left + width - 1
  y = top

lower right
  x = left + width - 1
  y = top + height - 1

Here are the lines which draw the 2 red lines. This is an exercise in knowing the coordinates of the four corners.
def draw_redx(canvas, left, top, width, height):
    ...
    # Draw red lines
    # upper-left to lower-right
    canvas.draw_line(left,              # x upper-left
                     top,               # y upper-left
                     left + width - 1,  # x lower-right
                     top + height - 1,  # y lower-right
                     color='red')

    # lower-left to upper-right
    canvas.draw_line(left, top + height - 1, left + width - 1, top, color='red')
Note: the first draw_line() shows one PEP8 style approved way to call a function with a lot of parameters, the second and later parameter lines are indented to match the first. Just writing it all on one line is fine too, as shown with the second call.
-redx 600 400The main() in this case with args like -redx 600 400 creates a canvas of that size and calls draw_redx() twice, once upper left and once lower right. This tests that the left,top are handled correctly. Open the "terminal" at the lower left of PyCharm. The "$" below is the prompt, the rest you type (on Windows its "python" or "py" instead of "python3".) Close the drawing window when done, this exits the draw program. Try different sizes.
$ python3 draw1.py -redx 600 400
Suppose I want to draw 3 vertical lines on a patch.
Vertical line at 50% across
Vertical line at 75% across
Vertical line at 100% across (at right edge)

Q: What is the x coordinate 50% across the patch?
Q: What is the x coordinate 75% across the patch?
x Some Percentage Across a RectangleHow to compute an x value that is some percentage of the way across the width of a shape, e.g. what is an x value that is 50% of the way across the rectangle?
Imagine starting at left and adding larger and larger numbers to specify farther right pixels in the rectangle. The maximum that can be added and still be in the rectangle is (width - 1) which gets us to the right edge, essentially 100%.
maximum can add to left: (width - 1)
Building on this pattern, we take a fraction, such as 50% or 75%, and multiply it by the maximum that can be added, (width - 1). Add the product to left to get the x value that percentage across the rectangle.

To figure a proportionate distance across a shape, the pattern is: fraction * max
The fraction is a number in the range 0.0..1.0, multiplied by the max possible addition, (width - 1)
x = left + 0.50 * (width - 1)       # 50% across
x = left + 0.75 * (width - 1)       # 75% across
x = left + 1.00 * (width - 1)       # 100% across
x = left + (3 / 4) * (width - 1)   # equiv fraction

in general
proportionate x = left + fraction * (width - 1)

fraction in range: 0.0 .. 1.0
def draw_percents(canvas, left, top, width, height):
    """
    Draw a vertical line halfway along the width.
    Another 75% way along the width.
    Another 100% along .. at the right edge.
    (this code is complete)
    """
    # Draw outer rectangle
    canvas.draw_rect(left, top, width, height, color='blue')

    # Vertical line halfway
    x50 = left + 0.50 * (width - 1)
    canvas.draw_line(x50, top,
                     x50, top + height - 1, color='red')

    # Vertical line 75%
    x75 = left + 0.75 * (width - 1)
    canvas.draw_line(x75, top,
                     x75, top + height - 1, color='red')

    # Vertical line 100%
    x100 = left + 1.0 * (width - 1)
    canvas.draw_line(x100, top,
                     x100, top + height - 1, color='red')
Run from command line
python3 draw1.py -percents 600 400
-1?A common question writing this sort of code, is .. do I need a -1 term in the formula?
As we see above, the -1 is needed to compute the rightmost or bottommost x or y, or to compute something which is proportionate to the rightmost or bottommost...
righmost = left + (width - 1)

halfway = left + 0.5 * (width - 1)
How to draw green lines from the upper-left corner to points 1/3 and 2/3 of the way down the right edge?

# y_add for point 2/3 way down
y_add = fraction * max
y_add = (2 / 3) * (height - 1)

# then the y value 2/3 way down is
y = top + y_add

Add code to draw_redx() to draw green lines from the upper left to points 1/3 and 2/3 of the way down the right edge.
Strategy
Compute add1 = distance 1/3 of the way down.
Compute add2 = distance 2/3 of the way down.
Draw a 1/3 line, a 2/3 line
    add1 = (1 / 3) * (height - 1)
    canvas.draw_line(left, top, left + width - 1, top + add1,
            color='green')

    add2 = (2 / 3) * (height - 1)
    canvas.draw_line(left, top, left + width - 1, top + add2,
            color='green')

3 in Denominator?
for i in range(n):
    y_add = (i / (n - 1)) * (height - 1)
    # call draw_line(), y = top + y_add
Working out a formula like this - check the i = 0 and i = n - 1 cases. If the two endpoints are correct, the whole thing is likely correct.
# what is this for the first and last i:
i = 0, i = n-1?

y = top + (i / (n - 1)) * (height - 1)
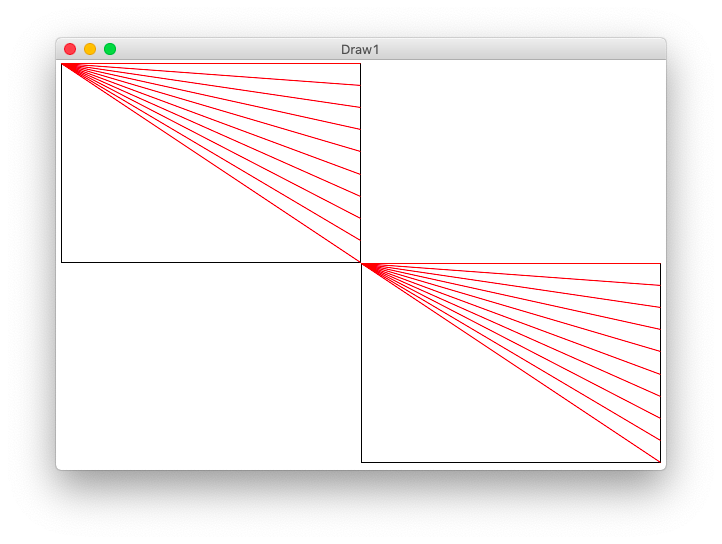
Here is the y_add pattern at work to draw n red lines from the upper left corner, all to a series of points running down the right side.
def draw_lines1(canvas, left, top, width, height, n):
    """
    Draw the lines1 figure within left,top .. width,height
    (this code is complete)
    """
    canvas.draw_rect(left, top, width, height)

    # Figure y_add for each i in the loop
    for i in range(n):
        # formula: fraction * max
        y_add = (i / (n - 1)) * (height - 1)
        canvas.draw_line(left, top,
                         left + width - 1, top + y_add,
                         color='red')
This command line will call the draw_lines1() function. The last number is n - try different values.
$ python3 draw1.py -lines1 600 400 12
What if we wanted to draw the lines alternating red, green, red, green...
A common way to do this is use modulus - look at the value of i % 2 in the loop. It will be either 0 or 1 alternating. (Modulus result is always 0..n-1). If it's 0 draw red, otherwise draw green.
draw_lines1() with alternating color:
    for i in range(n):
        y_add = (i / (n - 1)) * (height - 1)  # formula: fraction * max
        if i % 2 == 0:
            canvas.draw_line(left, top, left + width - 1, top + y_add, color='red')
        else:
            canvas.draw_line(left, top, left + width - 1, top + y_add, color='green')
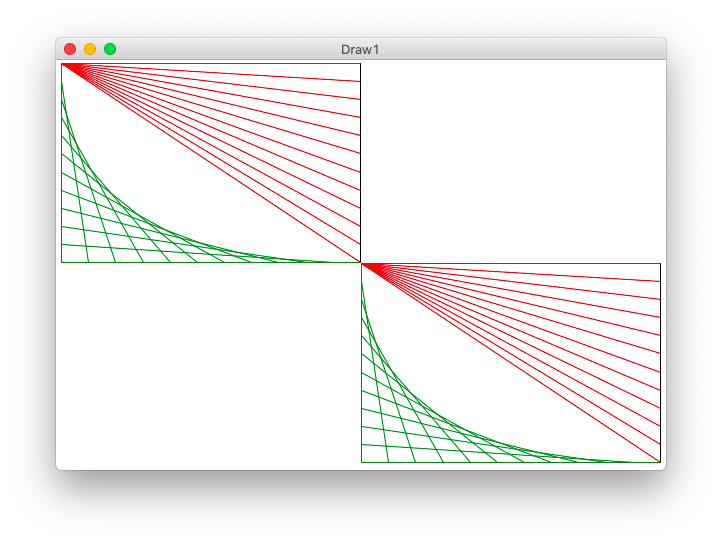
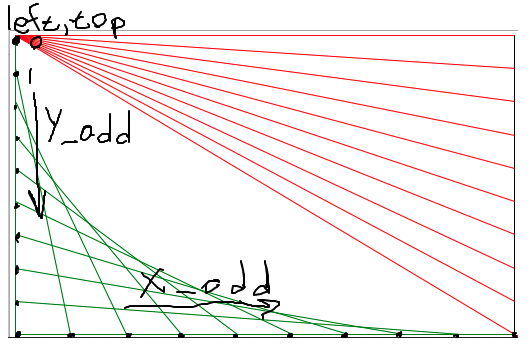
The code below has y_add done. Work out the formula for x_add, then draw the green lines. Look at the drawing to work out the x1,y1 x2,y2 for the green line. Demo-note: try to have the drawing visible while students work out the code for this.
    # loop to draw green "lines2" lines
    for i in range(n):
        y_add = (i / (n - 1)) * (height - 1)
        pass
        # work out x_add, draw each green line
Run from the command line:
$ python3 draw1.py -lines2 600 400 12
       ...
       y_add = (i / (n - 1)) * (height - 1)
       x_add = (i / (n - 1)) * (width - 1)
       canvas.draw_line(left, top + y_add,
                        left + x_add, top + height - 1,
                        color='green')
That code is tricky for sure. The variable names are helping - x_add and y_add are short but meaningful labels about each value's role in the computation. Someday, you may work with some bad style code where the variables are just named a b c d .. and you will appreciate that good variable names help work out these lines.
Say there is a thing at the left of the canvas, and its width is: a
The x value immediately to the right of the thing is: a

e.g. The thing is width 126. So it occupies x values 0 .. 125. The next thing begins at x = 126
This is a case where zero-based indexing comes out very neatly.
If we have a thing width a and a thing width b, and we place them next to each other.
The combined with of the two things is: a + b
There is no - 1 in here.

e.g. One thing is 100 pixels wide, and it is next to a thing which is 26 pixels wide — together they are 126 pixels wide. Also following the first rule, the x value to the right of the combination is 126
>>> # e.g. canvas width is 500, 10 columns
>>>
>>> sub_width = 500 / 10
>>> sub_width
50.0   # float is ok
>>>
>>> # or if we had 13 cols .. this works
>>> 500 / 13
38.46153846153846
We have a n-by-n grid of cells on a canvas with a given width. We have the sub_width of a single cell in the grid. It's computed by dividing the total width by the number of columns (note: floating point divide works correctly here).
sub_width = width / num_cols
For each column, what is the left coordinate of its upper-left pixel?

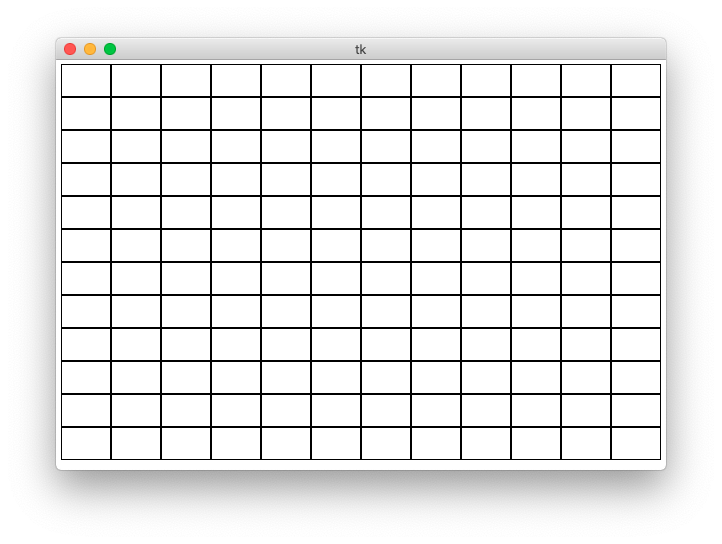
def draw_grid1(width, height, n):
    """
    Creates a canvas.
    Draws a grid1 of n-by-n black rectangles
    (this code is complete)
    """
    canvas = DrawCanvas(width, height, title='Draw1')

    # Figure sizes for all sub rects
    sub_width = width / n
    sub_height = height / n

    # Loop over row/col
    for row in range(n):
        for col in range(n):
            # Figure upper left of this sub rect
            left = col * sub_width
            top = row * sub_height
            canvas.draw_rect(left, top,
                             sub_width, sub_height)
Run from command line:
$ python3 draw1.py -grid1 600 400 12
Change the code to draw a filled oval of some color for each sub-rect. Whatever function call we put inside the loop, we get n * n copies of whatever that function draws.
            ...
            left = col * sub_width
            top = row * sub_height
            canvas.fill_oval(left, top,
                             sub_width, sub_height, color='green')
Zero based indexing makes some cases come out more easily. In particular, zero based indexing works well to compute the offset of each numbered thing from the origin. Thing at index 0 needs no offset, index 1 needs one offset unit, and so on. This works neatly to figure the left of each cell, since the col number is directly proportionate to the offset, e.g. col 2, corresponds to skipping over 2 whole cells.
left = col * sub_width
Now we'll make a big jump.
Here is the draw_lines2() def first line:
def draw_lines2(canvas, left, top, width, height, n):
    """
    Draw lines2 figure within left,top .. width,height
    The code for lines1 is already here
    """
def draw_grid2(width, height, n):
    """
    Creates a canvas.
    Add code to draw the lines2 figure in each grid sub rect.
    """
    canvas = DrawCanvas(width, height, title='Draw1')

    sub_width = width / n
    sub_height = height / n

    for row in range(n):
        for col in range(n):
            # Your code here - draw a lines2 figure in each grid rect
            pass
            left = col * sub_width
            top = row * sub_height
            # Key line: call function to do it,
            # passing in left,top,width,height,n we want
            draw_lines2(canvas, left, top, sub_width, sub_height, n)
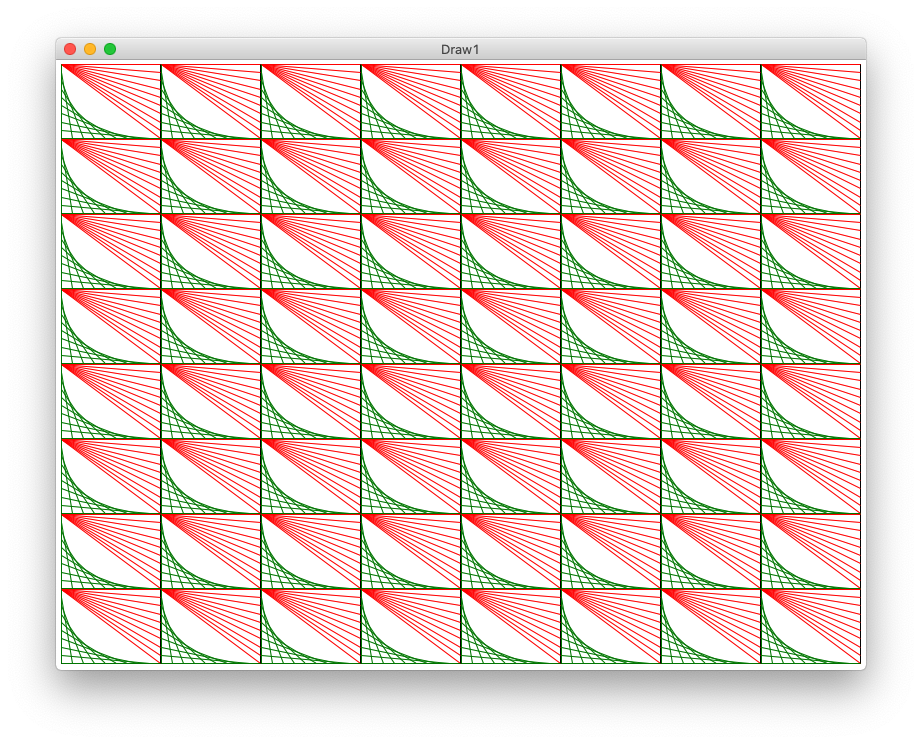
Looks neat - loops + function-call = power!
$ python3 draw1.py -grid2 800 600 8