Assignment 3: Working with Processes
This handout was adapted from material by Jerry Cain, Nick Troccoli, and Chris Gregg.
We’ve progressed through a good amount of material involving processes and synchronization. In this assignment, you’ll implement two small-ish programs that will exercise your understanding of concurrency, synchronization, and inter-process communication. You can get the starter code by typing the following:
git clone /usr/class/cs110/repos/assign3/$USER assign3
Due Date: Tuesday, July 20, 2021 at 11:59pm pacific time
Program 1: trace
In this part of the assignment, you’ll implement a debugging utility that allows you to intercept and display the system calls that a process makes.
What is trace?
Recall that a process is sort of like an unprivileged box in which a sequence of assembly instructions executes:

The program can freely work with anything inside the box (variables, functions, etc.), but any time it wants to interact with the outside world, it must use a system call to do so.
Most debugging techniques you’ve encountered so far focus on debugging within
the box. What functions are being called? What is the value of variables? Which
if statements are executing? This works great in a controlled environment:
when you’re able to run and re-run the program on your own machine with
different inputs, when you’re running an unoptimized binary with debugging
symbols available, when you’re able to step through with breakpoints or add
print statements, and so on.
However, debugging production applications can be less forgiving. Production
applications are generally compiled at high optimization levels with no
debugging symbols included, which can make it very difficult to step through
the code being executed. It’s often not possible to step through code in gdb
or add print statements when the failing application is running on some remote
server instead of your local machine. Maybe you’re even trying to reverse
engineer what some software (or maybe some malware) does, in a situation where
you don’t have any source code available and the original authors tried to
obfuscate what the binary is doing.
In these cases, sometimes it is helpful to take a different approach to debugging: instead of trying to look at everything happening inside the box, we can observe how the box is interacting with the outside world, and then we use that information to figure out what’s going on. It’s like the old thought experiment: “If a tree falls in a forest and no one is around to hear it, does it make a sound?” If a program has a bug but never makes any system calls to expose that bug to the outside world, does it really have a bug? Probably not, at least not one that we care about. Every interaction with the outside world must happen through syscalls, therefore by observing how a program interacts with the world, we can identify the specific behaviors that are causing problems without needing to follow everything happening inside the box.
Various trace programs let us do this. Linux has strace, Mac has dtrace,
and Windows has its own suite of tools. In this assignment, you’ll implement a
program with all of the core functionality that strace has!
Sample execution
Consider, for example, the following nonsense program (drawn
from simple-test5.cc in your assign3 repo).
int main(int argc, char *argv[]) {
  write(STDOUT_FILENO, "12345\n", 6);
  int fd = open(__FILE__, O_RDONLY);
  write(fd, "12345\n", 6);
  close(fd);
  read(fd, NULL, 64);
  close(/* bogusfd = */ 1000);
  return 0;
}
A simple trace of the command ./simple-test5 might look like this:
$ ./trace --simple ./simple-test5
syscall(59) = 0
syscall(12) = 14434304
// many lines omitted for brevity
syscall(1) = 12345
6
syscall(2) = 3
syscall(1) = -9
syscall(3) = 0
syscall(0) = -9
syscall(3) = -9
syscall(231) = <no return>
Program exited normally with status 0
It may look like a bunch of random numbers, but the numbers in parentheses are
system call opcodes (59 is the opcode for execve, 12 is for brk, 1 is
for write, 2 is for open, 3 is for close, 0 is for read, and 231
is exit_group) and the numbers after the equals signs are return values (that
6 is the number of characters just published by write, the -9’s
communicate write's, read's, and close's inability to function when
handed closed, incompatible, or otherwise bogus file descriptors, and
exit_group never returns).
When run in simple mode, these CPU snapshots are printed without much
translation. You’ll also implement a full mode in which trace displays the
same system calls but with much more detailed information - the register values
are translated to full system call names, strongly typed argument lists
(e.g., ints, C strings, pointers), and properly interpreted return values:
$ ./trace ./simple-test5
execve("./simple-test5", 0x7fff725831e0, 0x7fff725831f0) = 0
brk(NULL) = 0xd4b000
// many lines omitted for brevity
write(1, "12345
", 6) = 12345
6
open("simple-test5.cc", 0, 6) = 3
write(3, "12345
", 5) = -1 EBADF (Bad file descriptor)
close(3) = 0
read(3, NULL, 64) = -1 EBADF (Bad file descriptor)
close(1000) = -1 EBADF (Bad file descriptor)
exit_group(0) = <no return>
Program exited normally with status 0
You can see the return values, if negative, are always -1. When the return
value is -1, the value of errno is printed after that in #define constant
form (e.g. EBADF), followed by a specific error message in parentheses
(e.g. “Bad file descriptor”). If the return value is nonnegative, then that
return value is simply printed and errno is ignored as irrelevant.
Real-world usage
trace is an invaluable tool for debugging production systems. This blog post
by Julia
Evans
provides an excellent list of different use cases. (Her blog is also filled
with many other gems for learning about computer systems.)
How do syscalls work?
We have been talking about how the kernel is the one that executes the code
implementing syscalls (e.g. when you call write(), it’s the kernel talking to
the disk on your behalf). Regular programs don’t have the ability to execute
the special assembly instructions or access special registers for interacting
with hardware, controlling virtual memory, or any of the other things the
kernel can do. We also mentioned how the kernel executes its code within its
own virtual address space, preventing ordinary programs from seeing this
memory.
How does this work? How does the CPU switch from user/unprivileged mode to kernel/privileged mode, and how does it switch from running ordinary program code to running code that’s part of the kernel?
When you call a syscall such as write(), the following things happen:
- The implementation of the syscall function (e.g.
write) sets the register%raxto an opcode, which is a number indicating which system call we’re trying to run. You can find a list of opcodes here. In addition, the parameters for the syscall are placed in the registers%rdi,%rsi,%rdx,%r10,%r8, and%r9, in that order. - The syscall function executes the instruction
int 0x80. Theintinstruction performs a “software interrupt,” which transfers control to an “interrupt handler” in the kernel. There are many different kinds of interrupts (e.g. when you segfault or divide by zero, control flow jumps to a handler that prints an error and terminates the program). The interrupt0x80is the system call interrupt, and when your program runsint 0x80, the CPU switches into kernel mode and starts running the kernel function that handles system calls. - The kernel system call interrupt handler looks at
%raxto see which system call the program was trying to execute, and calls the appropriate function within the kernel. The kernel places the return value back into the%raxregister, then runs thesysretqinstruction to switch back into user/unprivileged mode. Our program picks up where it left off, right after theint 0x80instruction.
If you’re curious for more details, this page has an excellent overview of everything that happens in the kernel, with lots of links to kernel source code.
How does trace work?
Implementing trace will involve working with two processes. The child process
will be used to execute the program we wish to observe (e.g. ./simple-test5).
The parent process will follow its execution, printing out each syscall that
the child makes.
At the heart of trace is a system call named ptrace. A quick glance
at ptrace's man page provides the following:
The ptrace system call provides a means by which one process (the “tracer”) may observe and control the execution of another process (the “tracee”), and examine and change the tracee’s memory and registers. It is primarily used to implement breakpoint debugging and system call tracing.
This is a really, really, really complicated syscall that can do a lot of things (it’s also how GDB is implemented!), but we’ll break down how it works here.
The prototype of ptrace looks like this:
long ptrace(enum __ptrace_request request, ... other arguments ...);
This is really several functions bundled into one. The first argument is a
constant indicating what you want to do (e.g. PTRACE_TRACEME,
PTRACE_PEEKUSER, PTRACE_SYSCALL, etc.), and based on this constant, other
arguments might be required.
There are four commands that are important for implementing trace:
ptrace(PTRACE_TRACEME)should be called in the child process, before starting to execute the program we want to trace, to tell the kernel that it wants its parent process to be able to observe its execution.- When the tracing starts, the child process will be paused (as in
SIGSTOPpaused; it will not continue until it receivesSIGCONT).ptrace(PTRACE_SYSCALL, pid_t pid, 0, 0)should be called in the parent process, which will sendSIGCONTto the child to wake it up, but will pause the child again as soon as it reaches a syscall boundary. You can think of a syscall boundary like the speech bubbles in the picture above:PTRACE_SYSCALLwill pause the child right when it asks the kernel to do something, and right when the kernel finishes running the syscall. ptrace(PTRACE_PEEKUSER, pid_t pid, REGISTER_NAME * sizeof(long))is called in the parent process in order to read a register value from inside the child process.ptracewill return the value of the register as along.ptrace(PTRACE_PEEKDATA, pid_t pid, void *address_to_read)is called by the parent to read along(8 bytes) fromaddress_to_readin the child’s virtual address space.ptracereturns the value that was read as along.
Tracing generally goes like follows:
- The child uses
PTRACE_TRACEMEto tell the kernel that it wants to be traced, and then goes to sleep until the parent process is ready to start tracing. Once everything is ready, the child callsexecvpto start running the program we want to trace (e.g../simple-test5). - The parent waits for the child to be set up. Then, it uses
PTRACE_SYSCALLto wake up the child and waits until the child makes a syscall. - The kernel will pause the child just as it’s about to make a syscall, and it
will wake up the parent. The parent uses
PTRACE_PEEKUSERandPTRACE_PEEKDATAto look at the child process’s registers and memory, figuring out which system call is being executed and what arguments were provided. - The parent uses
PTRACE_SYSCALLagain to run the child until the next syscall boundary (which is when the syscall is returning). - The kernel will pause the child again just as it’s returning from the
syscall, and it will wake up the parent. The parent uses
PTRACE_PEEKUSERandPTRACE_PEEKDATAagain to get the return value of the syscall, and to readerrnofrom the child’s memory if the syscall returned -1. - The parent calls
PTRACE_SYSCALLto wake up the child again, and waits for the child to make its next syscall.
Starter Code Walkthrough
The provided starter code shows how you can set up the child process and
monitor a single syscall using ptrace. When the initial version of trace.cc
is compiled and invoked to profile simple-test5, we see it just prints out
information about the first system call:
$ ./trace --simple ./simple-test5
syscall(59) = 0
Syscall 59 is execve, which is
used to implement execvp. Since execvp is the first syscall the child makes
after the tracing process is set up, this is what we expect!
In this assignment, you’ll have two jobs:
- First, we need to extend this code to print out every syscall the child makes, from start to finish, instead of just printing one.
- Second, we need to implement the “full” mode, which prints out syscall names, arguments, and more detailed return info.
Before writing any code, make sure you truly understand what every line in the starter code does.
Handling command-line flags
Let’s walk through the starter code in main, starting with
the first few lines (note: you can ignore the provided readString function
for now, that will become relevant when you start implementing full trace):
int main(int argc, char *argv[]) {
  bool simple = false, rebuild = false;
  int numFlags = processCommandLineFlags(simple, rebuild, argv);
  if (argc - numFlags == 1) {
    cout << "Nothing to trace... exiting." << endl;
    return 0;
  }
The starter version ignores whatever simple and rebuild are set to, even
though the code you write will eventually rely on them. The implementation
of processCommandLineFlags resides in trace-options.cc, and that
implementation parses just enough of the full command line to figure out how
many flags (e.g. --simple and --rebuild) sit in between ./trace and the
command to be traced. processCommandLineFlags accepts simple and rebuild
by reference, updating each independently depending on what command line flags
are supplied. Its return value is captured in a variable called numFlags, and
that return value shapes how execvp is invoked in the code that follows.
Setting up tracing
Next, we create the child process and do some work to set up tracing.
Here’s a graphical summary of what happens:
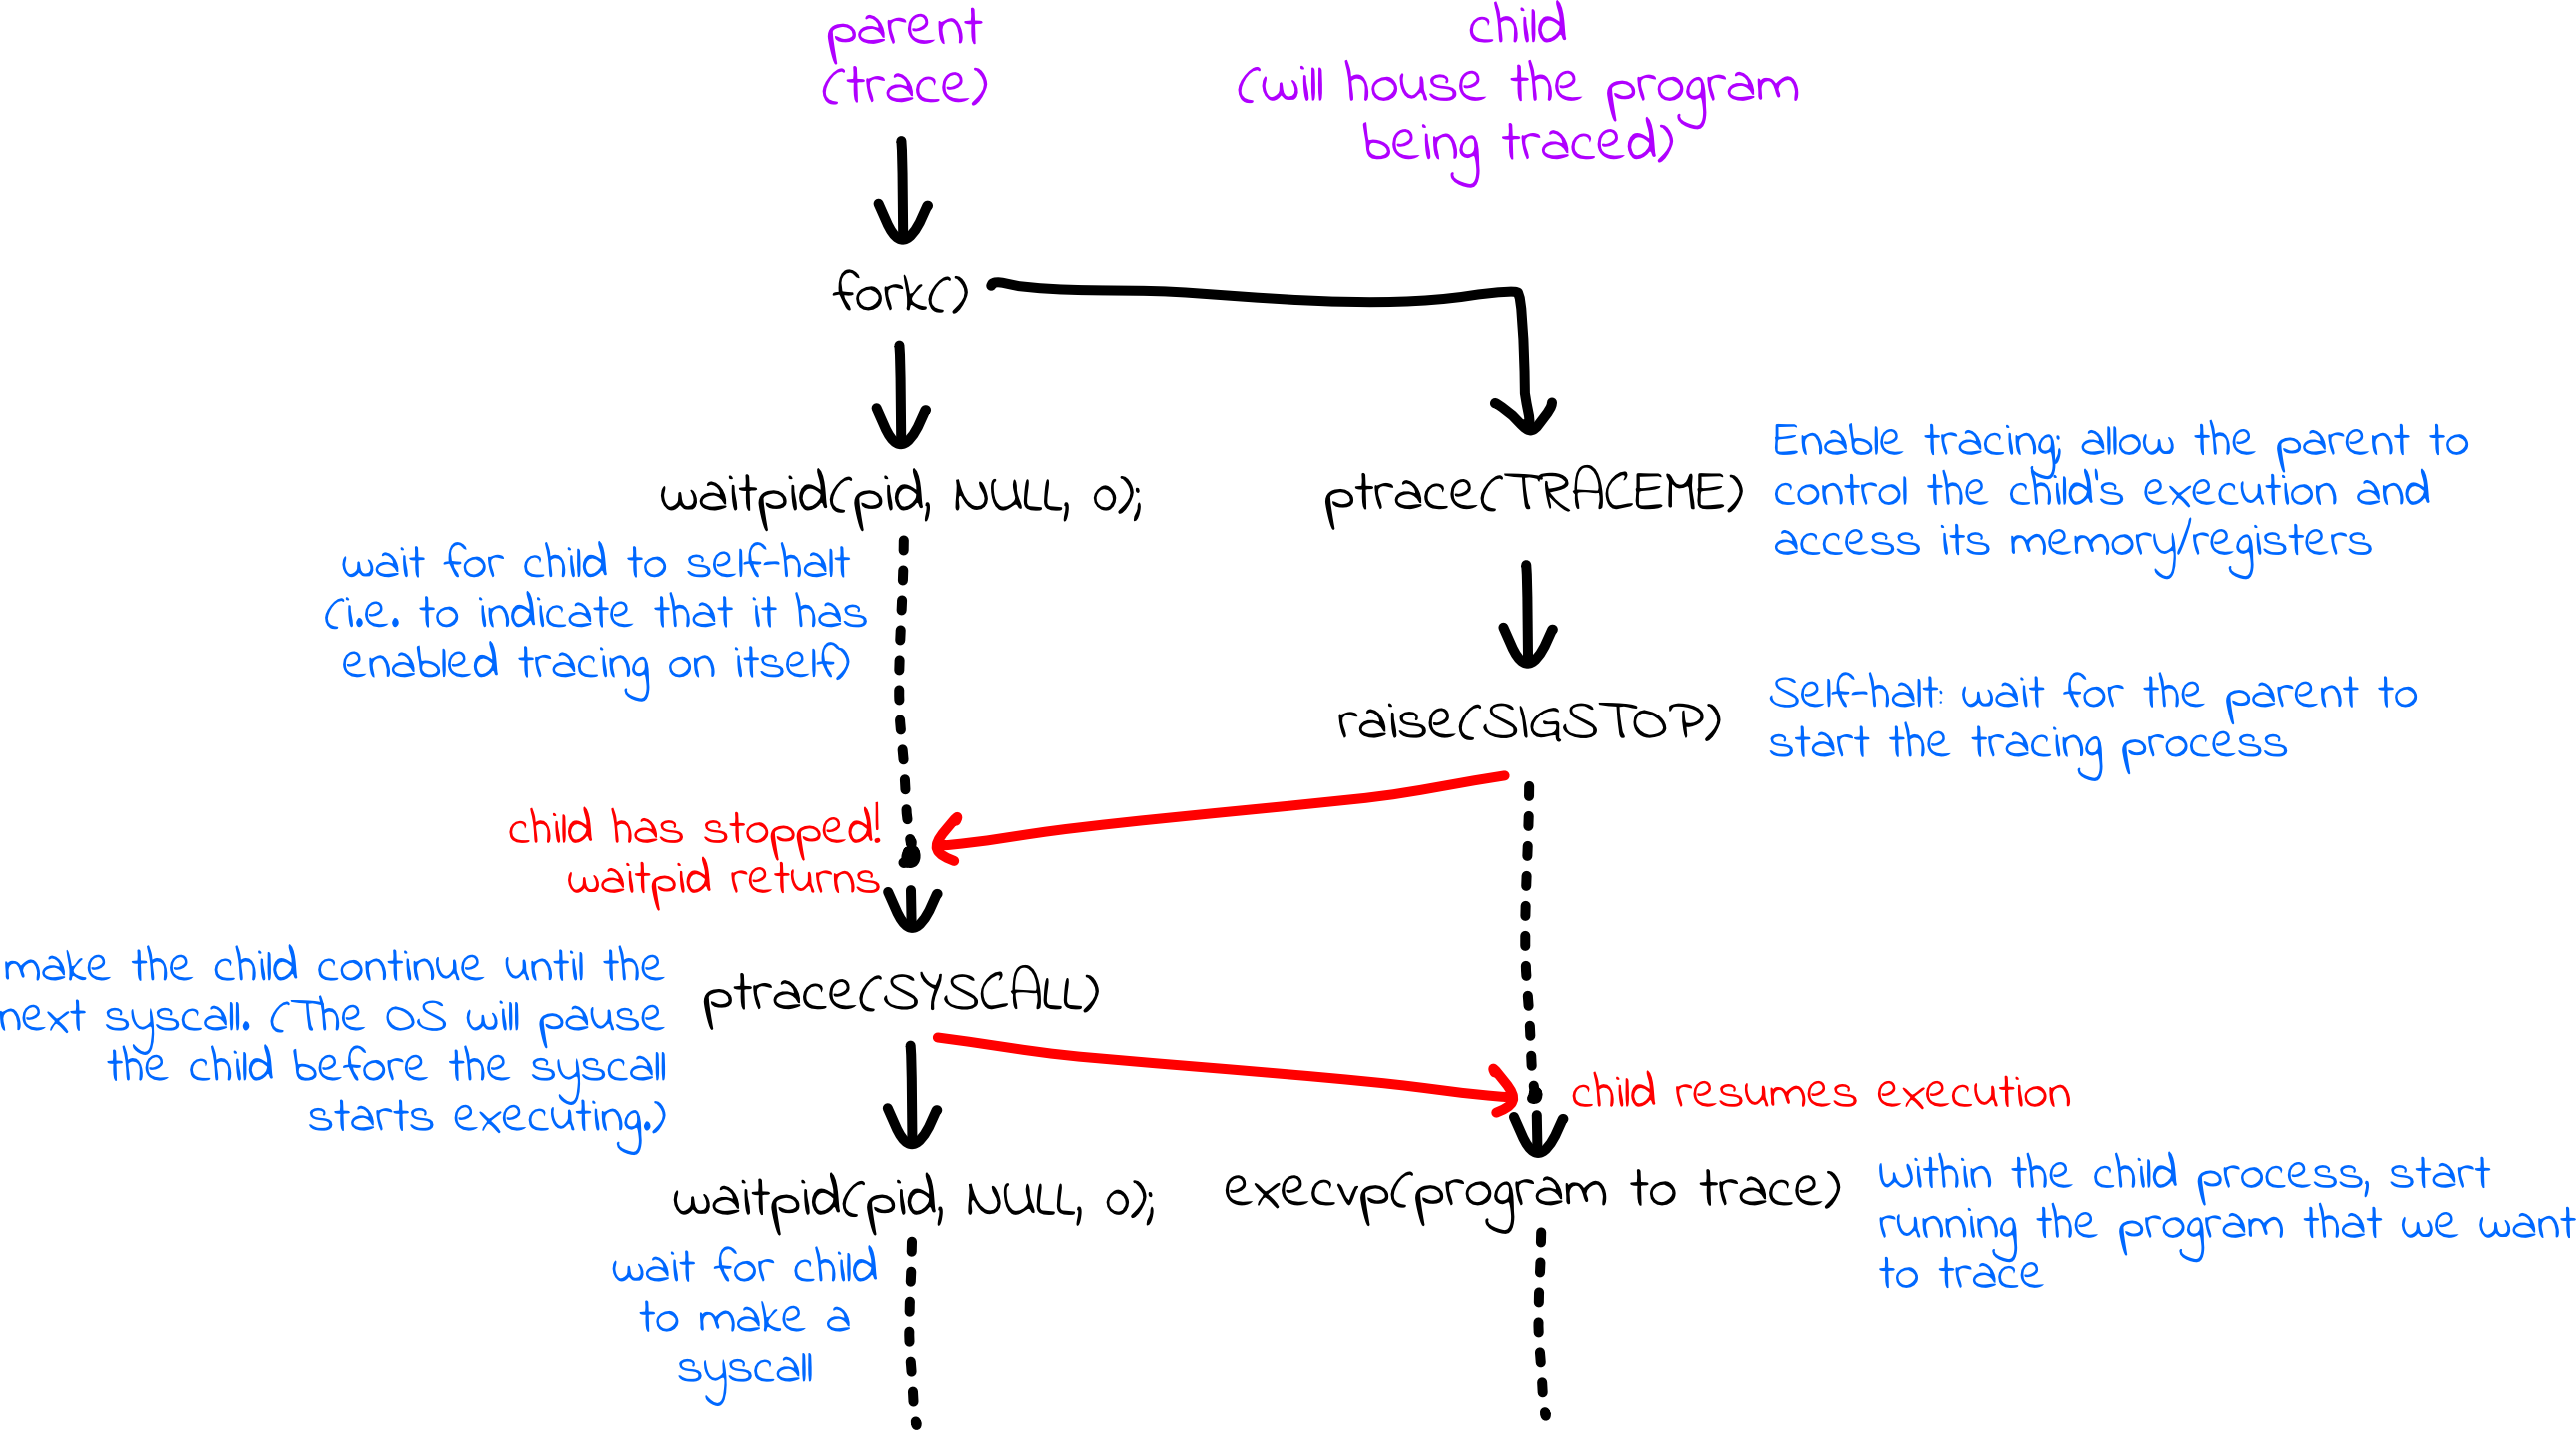
First, we fork off a child process that ultimately executes the program of interest:
pid_t pid = fork();
if (pid == 0) {
  ptrace(PTRACE_TRACEME);
  raise(SIGSTOP);
  execvp(argv[numFlags + 1], argv + numFlags + 1);
  return 0;
}
A new process is created via fork, and the child process:
- calls
ptrace(PTRACE_TRACEME)to inform the OS that it’s content being monitored by the parent process, - calls
raise(SIGSTOP)and awaits parental permission to continue, and - calls
execvp(argv[numFlags + 1], argv + numFlags + 1)to transform the child process to run the command to be profiled.
We’re used to seeing argv[0] and argv as the two arguments, but argv[0]
is ./trace. Here, execvp's first argument needs to be the name of the
executable to be monitored, and we get to that by looking past the arguments
for actual trace. Provided the execvp succeeds, the child process is
consumed with a new executable and proceeds through its main function,
unaware that it’ll be halted every time it makes a system call.
The return 0 at the end is relevant in the event that argv[numFlags + 1]
names an executable that either doesn’t exist or can’t be invoked because of
permission issues. We need to ensure the child process ends in the event that
execvp fails, else its execution will flow into code designed for the tracer,
not the tracee.
Meanwhile, the parent skips the code specific to the child and executes the following lines:
int status;
waitpid(pid, &status, 0);
assert(WIFSTOPPED(status));
ptrace(PTRACE_SETOPTIONS, pid, 0, PTRACE_O_TRACESYSGOOD);
The parent (tracer) process:
- calls
waitpidto halt until the child process has granted permission to be traced and self-halted. - calls
assertto confirm that the child self-halted - calls
ptraceto instruct the operating system to set bit 7 of the signal number – i.e., to deliverSIGTRAP | 0x80– whenever a system call trap is executed. (A trap is the same thing as a software interrupt.)
The tracing process
Next, the parent and child synchronize so that the child stops on every syscall boundary, and the parent gets a chance to inspect and print what is happening.
Here’s a graphical summary of what happens:
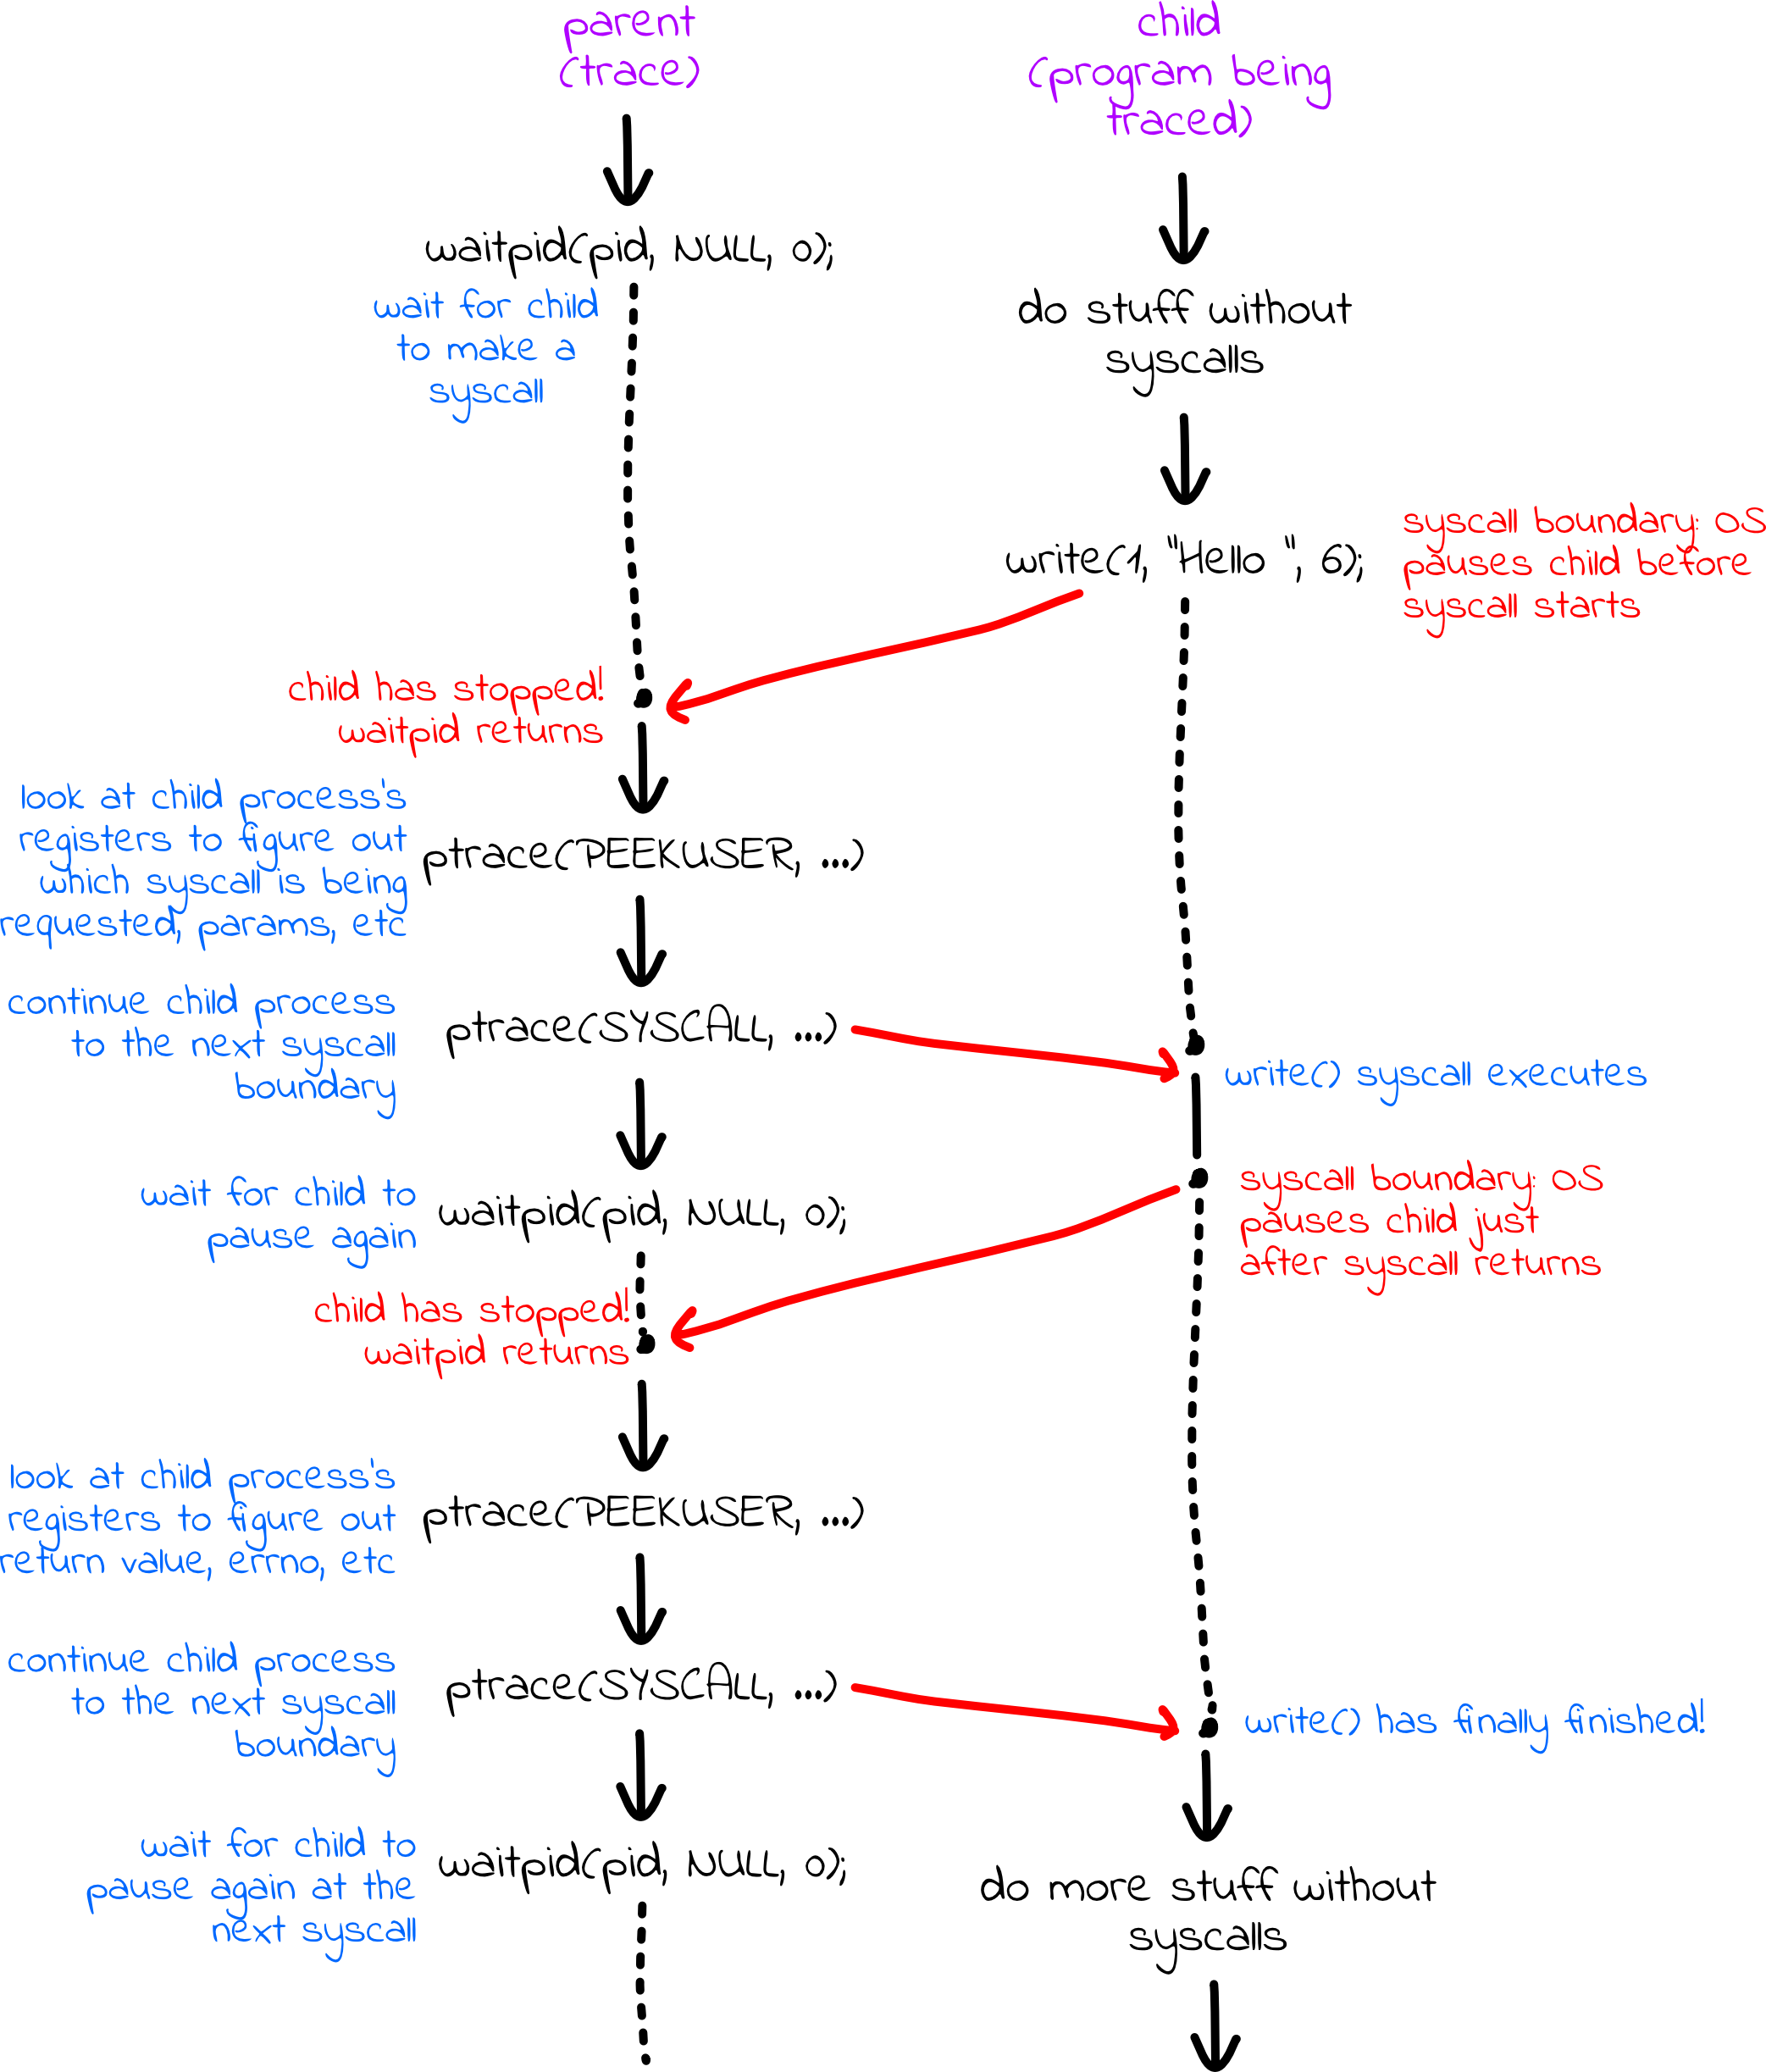
In the code, the tracer (parent) tells the tracee (child) to proceed until it’s just about to execute a system call:
while (true) {
  ptrace(PTRACE_SYSCALL, pid, 0, 0);
  waitpid(pid, &status, 0);
  if (WIFSTOPPED(status) && (WSTOPSIG(status) == (SIGTRAP | 0x80))) {
    int num = ptrace(PTRACE_PEEKUSER, pid, ORIG_RAX * sizeof(long));
    cout << "syscall(" << num << ") = " << flush;
    break;
  }
}
Here’s a breakdown of what each line within the while loop does:
ptrace(PTRACE_SYSCALL, pid, 0, 0)continues a stopped tracee until it enters a system call (or is otherwise signaled).- The
waitpid(pid, &status, 0)call blocks the tracer until the tracee halts. Note:waitpidusually waits for processes to terminate, but if the child process has tracing enabled,waitpidwill also return when that process has stopped. This means you can callwaitpidseveral times on the same process. - If the tracee stops because it’s entering a system call, then the
WIFSTOPPED(status)will certainly producetrue. If the tracee stopped because it’s entering a system call, then the tracee would be signaled withSIGTRAP | 0x80, as per the above discussion of whatptrace(PTRACE_SETOPTIONS, pid, 0, PTRACE_O_TRACESYSGOOD)does. If either of the two tests&&'ed together fails, then the tracee halted for some other reason, and the tracer resumes the tracee. - Eventually, the tracee stops because it’s entering its first system
call–that is, the tracee stops just after the system call opcode has been
placed in
%rax, any additional arguments are placed in%rdi,%rsi,%rdx,%r10,%r8, and%r9, as needed, and the software interrupt instruction–int 0x80–has been executed. Theptrace(PTRACE_PEEKUSER, pid, ORIG_RAX * sizeof(long))is another flavor ofptrace, and this one extracts the value in%raxjust as the tracee was forced off the CPU. (For reasons we won’t go into, the value of%raxis clobbered by the user-to-kernel mode transition, but a pseudo-register%orig_raxpreserves the value, specifically for system call traces like we’re managing here.) - For now, we are just going to get the system call opcode - we’re ignoring
system call parameters. We extract the opcode from
%orig_raxand print it withcout << "syscall(" << num << ") = " << flush.
At this point, we have printed information about what system call is being made. Next, we want to print out what it returns.
while (true) {
  ptrace(PTRACE_SYSCALL, pid, 0, 0);
  waitpid(pid, &status, 0);
  if (WIFSTOPPED(status) && (WSTOPSIG(status) == (SIGTRAP | 0x80))) {
    long ret = ptrace(PTRACE_PEEKUSER, pid, RAX * sizeof(long));
    cout << ret << endl;
    break;

  }
}
This loop is extremely similar to the first loop. We tell the tracee to
resume, and wait for it to halt again, at which point we know it has just
exited the system call. Then we extract the return value from %rax (which
hasn’t been clobbered–so RAX is correct, not ORIG_RAX), and print it out.
Note that ret is a long instead of an int; system call return values can
be pointers, so all 64 bits matter. The system call opcode, however, is always
small enough to fit in an int, which is why we go with an int instead of a
long in the first while loop.
The rest of the starter code is placeholder and should be removed as you
develop a fully operational trace. It exists simply to kill the tracee and
wait for it to die before allowing the tracer to return.
kill(pid, SIGKILL);
waitpid(pid, &status, 0);
assert(WIFSIGNALED(status));
return 0;
That’s why the starter code prints information about the first system call, but none of the others.
Part 1: Simple Trace
Your first task is to modify and build on the starter code as needed to
implement “simple” mode for trace, which prints out the full sequence of
system call opcodes and return values, as shown in the very first sample
output above for ./trace --simple ./simple-test5. The key challenge is you have no idea how many system calls a
monitored process makes, so you’ll need to update the code to repeatedly halt
on system call enter, exit, enter, exit, and so forth, until you notice that
the tracee truly exits in the WIFEXITED sense. As part of this, you should
combine the two while loops in the starter code into one, and
decompose it into a function that is called from two places (the only
reason we replicated the code in the starter trace.cc file was to simplify
the discussion of how it works).
Here are some other important notes:
- You may assume that the traced programs are never delivered any non-trap signals and never execute any signal handlers. It wouldn’t be that much more difficult to support arbitrary signals and signal handlers, but it’d just be more code that wouldn’t add much, and we haven’t spent the time talking about signal handling yet.
- System calls don’t predictably return the same values with each execution,
and one system call’s return value may be be passed as an argument to another
system call down the line. The
sanitycheckand theautograderare sensitive to all this–at least for the system calls relevant to the all of the test programs we’ve exposed–and use regular expressions that match and replace parameters and return values that are permitted, and even likely, to vary from test run to test run. - Make sure that everything up through and including the equals sign (e.g.
syscall(231) =) is printed and flushed to the console before you allow the tracee to continue. Doing so will help align your output with that of the sample executable, and will make thesanitycheckandautogradertools happy. This is important when the system calls themselves print to the console (e.g.write(STDOUT_FILENO, "12345\n", 6)), so that the system call output interleaves withtrace's output in a predictable way.
Test simple mode thoroughly before moving on - you will add to this code in the next part, full trace.
Part 2: Full Trace
Next, you will further modify this code to support “full” mode for trace; the
overall architecture of the program is largely the same, but more information
is printed out, as shown in the second sample output
above for ./trace ./simple-test5. There are
three new main features: instead of opcodes, you will print function names,
you will also print the function parameters, and you will print type-correct
return values and appropriate error codes.
Function Names
How do you convert system call opcodes (e.g. 59) to system call names (e.g.
execve)? We provide a function compileSystemCallData, documented in
trace-system-calls.h, that populates two maps of data, the first of which
contains opcode-to-name information, and is guaranteed to include every
legitimate opcode as a key. Each key maps to the corresponding system call
name, so that 0 maps to read, 1 maps to write, 2 maps to open, 3, maps to
close, and so forth. You can rely on the information in this map–which you
should only construct if you’re running in full mode–to convert the 0’s to
reads and the 59’s to execve's, etc. (Optionally, if you’re interested,
you can look inside the implementation of compileSystemCallData within
trace-system-calls.cc, and you’ll see that the map is built by parsing
/usr/include/x86_64-linux-gnu/asm/unistd_64.h.)
Function Arguments
How do you print argument lists like those contributing to
execve("./simple-test3", 0x7ffdd1531690, 0x7ffdd15316a0)? The same
compileSystemData function populates a second map which contains system call
signature information. We can use this map to determine that, say, execve
takes a C string and two pointers, access takes a C string followed by an
integer, and that open takes a C string and two integers. The number of
arguments in the signature determines how many of the registers %rdi, %rsi,
%rdx, %r10, %r8, and %r9 are relevant. The entries in the map also
convey how the data in each of those registers–extracted using ptrace and
PTRACE_PEEKUSER–should be interpreted. All arguments are ints, pointers
(which should be printed with a leading 0x, unless it’s the zero pointer, in
which case it should be printed as NULL), or the base address of a
'\0'-terminated character array, aka a C string. If the type is unknown, you
should print <unknown>. Thus, the long returned by ptrace needs to be
truncated to an int, converted to a C++ string, or reinterpreted as a void * before printing it. One twist is that because the C strings reside in the
tracee’s virtual address space, we need to use ptrace and
PTRACE_PEEKDATA to extract the sequence of characters in chunks until we pull
in a chunk that includes a '\0'. We have provided a complete
implementation in the starter code of a readString function that you can use
as-is to read in a C string from the tracee’s virtual address space.
Note that some system call signature information isn’t easily extracted from
the Linux source code, so in some cases, the system call signature map
populated may not include a system call (e.g. arch_prctl comes to mind). If
the prototype information is missing from the map, print
<signature-information-missing> in place of a parameter list, as with
arch_prctl(<signature-information-missing>).
Function Return Value
How do you print out return value information according to its type, along with a corresponding error code, if any? If the return value was from…
brkormmap: print that value as a 64-bit pointer, with a leading0x- NOT
brkormmap, and the raw return value is…- nonnegative: print that value as an
int - negative: print as -1, and after that synthesize and print the
equivalent errno #define constant (e.g.
EBADForENOENT) and the corresponding error string, which is produced by a call tostrerror. Note that the realerrnoglobal hasn’t been set just yet; that comes a few instructions after the system call exits. But you can easily compute whaterrnowill soon be (and what should be printed by trace) by taking the absolute value of the raw return value and using that.
- nonnegative: print that value as an
For negative values, how do you convert the computed errno values to the
synthesized values? We provide a function compileSystemCallErrorStrings,
documented in trace-error-constants.h, that populates a map of data
containing errno-to-name information (again, the errno value is the absolute
value of the raw return value). A raw return value of -2, for instance,
becomes “ENOENT”, and a raw return value of -9 (which we see a bunch in the
simple trace of simple-test5) becomes “EBADF”. (Optionally, if you’re
interested, you can look inside the implementation within
trace-error-constants.cc). Then, you can use strerror, which also takes an
errno value, to get the corresponding error message; e.g. strerror(2) and
strerror(9) return "No such file or directory" and "Bad file descriptor",
respectively. Check out the man page for strerror for more information.
If a system call was made, but before returning the tracee finishes running,
then you can stop looping and print <no return>.
With these pieces in place, your trace executable should have a fully-functional “full” mode!
ptrace Constants Reference
The full list of ptrace constants we use for our own solution are presented right here:
PTRACE_TRACEME: Used by the tracee to state its willingness to be manipulated and inspected by its parent. No additional arguments are required, so a simple call toptrace(PTRACE_TRACEME)does the trick.ptrace(PTRACE_SYSCALL, pid, 0, 0)instructs a stopped tracee to continue executing as usual until it either exits, is signaled, is caught entering a system call, or is caught exiting one. The tracer relies onwaitpidto block until the tracer stops or exits.ptrace(PTRACE_SETOPTIONS, pid, 0, PTRACE_O_TRACESYSGOOD)instructs the kernel to set bit 7 of the wait status to be 1 for allSIGTRAPs associated with a tracee’s system call.PTRACE_PEEKUSER: Used by the tracer to inspect and extract the contents of a tracee’s register at the time of the call. Only the first three arguments are needed, and any value passed throughdatais ignored. A call toptrace(PTRACE_PEEKUSER, pid, RSI * sizeof(long)), for instance, returns the contents of the tracee’s%rsiregister at the time of the call (provided the suppliedpidis the process id of the tracee, of course). There are constants for all registers (RAX,RSI,RBX,RSP, etc), and the third argument is supposed to be scaled by the size of a word on that processor (which is, by definition, the size of along).PTRACE_PEEKDATA: Used by the tracer to inspect and extract the word of data residing at the specified location within the tracee’s virtual address space. A call toptrace(PTRACE_PEEKDATA, pid, 0x7fa59a8b0000)would return the eight bytes residing at address0x7fa59a8b0000within the tracee’s virtual address space, and a call toptrace(PTRACE_PEEKDATA, pid, ptrace(PTRACE_PEEKUSER, pid, RDI * sizeof(long))would return the eight bytes residing at another address, which itself resides in%rdi). If you know the contents of a register is an address interpretable as the base address of a'\0'-terminated C string, you can collect all of the characters of that string by a sequence ofPTRACE_PEEKDATAcalls, as implied by the partial implementation ofreadStringwe shared above.
Final Notes
- The very first time you run trace, you should expect it to take a while to
read in all of the prototype information for the linux kernel source tree.
All of the prototype information is cached in a local file after that (the
cache file will sit in your repo with the name
.trace_signatures.txt), so trace will fire up much more quickly the second time. Should you want to rebuild the prototype cache for any reason, you can invoke trace with the--rebuildflag, as with./trace --rebuild ./simple-test5. - The return value of
traceis always the return value of the tracee. Running the sample executable onsimple-test3should make it clear what we’re expecting. Note that you’re responsible for printing the last line (“Program exited normally…"). If an error occurs that causestraceto terminate early, it’s ok to terminate with a different status code. - You don’t need to do comprehensive error checking, but you may do so to help improve the robustness of your solution or to catch functionality issues as you’re working.
Program 2: Implementing farm in C++
Your final challenge is to harness the power of a computer’s multiple cores to
manage a collection of processes, each running in parallel to contribute its
share to a larger result. For the purposes of this problem, we’re going to
contrive a scenario where the computation of interest – the prime factorization
of arbitrarily large numbers – is complex enough that some factorizations take
multiple seconds or even minutes to compute. The factorization algorithm
itself isn’t the focus here, save for the fact that it’s potentially time
consuming, and that should we need to compute multiple prime factorizations, we
should leverage the computing resources of our trusty myth cluster to
multiprocess and generate output more quickly.
Consider the following Python program called factor.py:
self_halting = len(sys.argv) > 1 and sys.argv[1] == '--self-halting'
pid = os.getpid()
while True:
   if self_halting: os.kill(pid, signal.SIGSTOP)
   try: num = int(raw_input()) # raw_input blocks, eventually returns a single line from stdin
   except EOFError: break; # raw_input throws an EOFError when EOF is detected
   start = time.time()
   response = factorization(num)
   stop = time.time()
   print ' %s [pid: %d, time: %g seconds]' % (response, pid, stop - start)
You really don’t need to know Python to understand how it works, because every line of this particular program has a clear C or C++ analog. The primary things I’ll point out are:
- Python’s
printoperates just like C’sprintf(and it’s even process-safe) raw_inputreads and returns a single line of text from standard input, blocking indefinitely until a line is supplied (chomping the'\n') or until end-of-file is detectedfactorizationis something I wrote; it takes an integer (e.g.12345678) and returns the prime factorization (e.g.12345678 = 2 * 3 * 3 * 47 * 14593) as a string. You’ll see it when you open upfactor.pyin your favorite text editor.- The
os.killline prompts the script to stop itself (but only if the script is invoked with the'--self-halting'flag) and wait for it to be restarted viaSIGCONT
The following should convince you our script does what you’d expect:
$ printf "1234567\n12345678\n" | ./factor.py
1234567 = 127 * 9721 [pid: 28598, time: 0.0561171 seconds]
12345678 = 2 * 3 * 3 * 47 * 14593 [pid: 28598, time: 0.512921 seconds]
$ time printf "1234567\n12345678\n123456789\n1234567890\n" | ./factor.py
1234567 = 127 * 9721 [pid: 28601, time: 0.0521989 seconds]
12345678 = 2 * 3 * 3 * 47 * 14593 [pid: 28601, time: 0.517912 seconds]
123456789 = 3 * 3 * 3607 * 3803 [pid: 28601, time: 5.18094 seconds]
1234567890 = 2 * 3 * 3 * 5 * 3607 * 3803 [pid: 28601, time: 51.763 seconds]
real    0m57.535s
user    0m57.516s
sys    0m0.004s
$ printf "1001\n10001\n" | ./factor.py --self-halting
$ kill -CONT %1
1001 = 7 * 11 * 13 [pid: 28625, time: 0.000285149 seconds]
$ kill -CONT %1
10001 = 73 * 137 [pid: 28625, time: 0.00222802 seconds]
$ kill -CONT %1
$ kill -CONT %1
-bash: kill: (28624) - No such process
$ time printf "123456789\n123456789\n" | ./factor.py
123456789 = 3 * 3 * 3607 * 3803 [pid: 28631, time: 5.1199 seconds]
123456789 = 3 * 3 * 3607 * 3803 [pid: 28631, time: 5.1183 seconds]
real    0m10.260s
user    0m10.248s
sys    0m0.008s
This last test may look silly, but it certainly verifies that one process is performing the same factorization twice, in sequence, so that the overall running time is roughly twice the time it takes to compute the factorization the first time (no caching here, so the second factorization does it all over again).
Our factorization function runs in O(n) time, so it’s very slow for some
large inputs. Should you need to compute the prime factorizations of many
large numbers, the factor.py script would get the job done, but it may take a
while. If, however, you’re ssh'ed into a machine that has multiple
processors and/or multiple cores (each of the myths has eight cores), you can
write a program that manages several processes running factor.py and tracks
which processes are idle and which processes are deep in thoughtful number
theory.
You’re going to write a program – a C++ program called farm – that can run
on the myths to leverage the fact that you have eight cores at your
fingertips. farm will spawn several workers – one for each core, each
running a self-halting instance of factor.py, read an unbounded number of
positive integers (one per line, no error checking required), forward each
integer on to an idle worker (blocking until one or more workers is ready to
read the number), and allow all of the workers to cooperatively publish all
prime factorizations to standard output (without worrying about the order in
which they’re printed). To illustrate how farm should work, check out the
following test case:
$ time printf "1234567890\n1234567890\n1234567890\n1234567890\n1234567890\n1234567890\n1234567890\n1234567890\n" | ./farm
There are this many CPUs: 8, numbered 0 through 7.
Worker 4245 is set to run on CPU 0.
Worker 4246 is set to run on CPU 1.
Worker 4247 is set to run on CPU 2.
Worker 4248 is set to run on CPU 3.
Worker 4249 is set to run on CPU 4.
Worker 4250 is set to run on CPU 5.
Worker 4251 is set to run on CPU 6.
Worker 4252 is set to run on CPU 7.
1234567890 = 2 * 3 * 3 * 5 * 3607 * 3803 [pid: 4249, time: 95.5286 seconds]
1234567890 = 2 * 3 * 3 * 5 * 3607 * 3803 [pid: 4252, time: 95.5527 seconds]
1234567890 = 2 * 3 * 3 * 5 * 3607 * 3803 [pid: 4245, time: 95.5824 seconds]
1234567890 = 2 * 3 * 3 * 5 * 3607 * 3803 [pid: 4247, time: 95.5851 seconds]
1234567890 = 2 * 3 * 3 * 5 * 3607 * 3803 [pid: 4248, time: 95.6578 seconds]
1234567890 = 2 * 3 * 3 * 5 * 3607 * 3803 [pid: 4250, time: 95.6627 seconds]
1234567890 = 2 * 3 * 3 * 5 * 3607 * 3803 [pid: 4251, time: 95.6666 seconds]
1234567890 = 2 * 3 * 3 * 5 * 3607 * 3803 [pid: 4246, time: 96.254 seconds]
real    1m36.285s
user    12m42.668s
sys    0m0.128s
Note that each of eight processes took about the same amount of time to compute the identical prime factorization, but because each was assigned to a different core, the real (aka perceived) time is basically the time it took to compute the factorization just once. How’s that for parallelism!
Note that prime factorizations aren’t required to be published in order – that makes this all a little easier – and repeat requests for the same prime factorization are all computed from scratch.
Your farm.cc implementation will make use of the following C++ record, global
constants, and global variables:
static const size_t kNumCPUs = sysconf(_SC_NPROCESSORS_ONLN);
static vector<subprocess_t> workers(kNumCPUs);
The main function we give you includes stubs for all of the helper functions
that decompose it, and that main function looks like this:
int main(int argc, char *argv[]) {
   spawnAllWorkers();
   broadcastNumbersToWorkers();
   waitForAllWorkers();
   closeAllWorkers();
   return 0;
}
This final problem can be tricky, but it’s perfectly manageable provided you follow this road map:
- First implement
spawnAllWorkers, which spawns a self-haltingfactor.pysubprocess for each core and adds thesubprocess_tstruct to the globalworkersvector. You’ll want to have a look at thesubprocess.hfile to see how thesubprocess()function works. Each subprocess should executefactor.pyas specified bykWorkerArguments; we want to supply input to each child (i.e. numbers to factor), but we do not want to process the output of each child (the output will go straight to the terminal instead). You will need to assign each process to always execute on a particular core by leveraging functionality outlined in theCPU_SETandsched_setaffinityman pages (i.e. type inmanCPU_SETto learn about thecpu_set_ttype, theCPU_ZEROandCPU_SETmacros, and thesched_setaffinityfunction). - Implement a
getAvailableWorkerhelper function, which you’ll use to decompose thebroadcastNumbersToWorkersfunction in the next step. This function should wait until a worker has self-halted (i.e. sent itselfSIGSTOP), indicating that it is free to do work. Once a worker is available, this function should return itssubprocess_tstruct from theworkersvector. - Flesh out the implementation of
broadcastNumbersToWorkers. This function reads numbers from stdin and should distribute the numbers across thefactor.pychild processes. Once you’ve read a number, you should send it to an available worker by writing it to that worker’s input pipe (usedprintf) and wake up the worker by sendingSIGCONT. When writing the number into a pipe, don’t forget to include a newline so that the child can tell when it has finished reading all of the digits in a number. - Implement
waitForAllWorkers, which does more or less what it says – it waits for all workers to self-halt and become available. - Last but not least, implement the
closeAllWorkersroutine to coax all workers to exit by closing their input pipes and waking them up so they see that the input pipe has been closed. Finally, wait for them to all exit and ensure no zombie processes are left behind.
Your implementation should not make any invalid memory accesses or cause any
segfaults, and nothing you write should orphan any memory. (You shouldn’t need
to use malloc or new.) Don’t leak file descriptors (other than 0, 1, and
2), and don’t leave zombie processes behind.
Submitting your work
Once you’re done, you should run ./tools/sanitycheck all of your work as you
normally would and then run ./tools/submit.
Automated style checks
We are experimenting with including an automated style checker called
clang-tidy. This is an industry-standard tool that can catch many common
pitfalls such as forgetting to initialize variables, leaking memory, and much
more. There is a full list of checks
here, although we
are only using a subset of them.
To run clang-tidy on trace and farm, you can run make tidy. If you find
that clang-tidy is complaining about things you think aren’t a real problem,
please let us know, and we’ll either explain why the check is important or
we’ll remove the check for the future.
We have also included these checks in sanitycheck. For now, we won’t run
clang-tidy as part of functionality grading or assign its output any points.
That being said, many of the problems clang-tidy are related to
functionality, and we may deduct for stylistic problems during style grading,
so we highly recommend aiming for a clean tidy output.