Week 3 (and 4) Exercises: Error handling and I/O
Great job making it so far in the quarter! It has only been three weeks, but we’ve covered a lot of ground. You’ve now learned enough to build useful and practical programs!
Purpose
In these exercises, you’ll work through implementing a tool for inspecting file
descriptors that you can use to debug your CS 110 assignments. You’ll get some
practice with handling ownership/references and working with Option and
Result, and you’ll also get some (very light) exposure to object-oriented
programming in Rust!
Due date: Thursday, January 27, 11:59pm (Pacific time)
There are no exercises week 4, so we have some buffer time. I chose this deadline to keep you moving in the class, and incentivize you to start while material on error handling and ownership is still fresh, but, for this assignment in particular, feel free to ask for an extension if you’d like one!
I expect this to take 1.5-4 hours to complete. Use Slack if you have any questions, and please help me (and participate!) by responding to questions that others post.
As always, please let me know as things come up or if you are having particular difficulty with this assignment. I want you to sleep!
Getting the code
You should have received an invite to join this week’s Github repository. If you didn’t get an email invite, try going to this link:
https://github.com/cs110l/week3-YOURSUNETID
You can download the code using git as usual:
git clone https://github.com/cs110l/week3-YOURSUNETID.git week3
Inspecting File Descriptors
In this week’s assignment, you will build a tool to inspect the open files of processes. This is based on a tool that was the precursor to C Playground’s open files debugger, and it could be useful for debugging file descriptor issues in CS 110’s assignments 3 (multiprocessing) and 4 (Stanford shell).
A bit on what we’re working toward:
To use the tool you’re going to build to debug a file-descriptor-related problem, you would do the following:
- Add a
sleep(30)call at the point in the program where you want to see the file descriptor table. (The30is arbitrary – we just want to “pause” the program.) - Run the buggy program in one terminal window
- In a second terminal window,
sshinto the same myth machine (e.g.myth65.stanford.eduif that is where the first terminal window is logged in) and runinspect-fds <name or PID of your program>
inspect-fds should then print a representation of the file descriptor tables at
that point in time. For example, here is the output where a parent process
creates two pipes and forks, using the file descriptor 4 to write data to the
child process’s stdin and file descriptor 5 to read data from the child
process’s stdout:
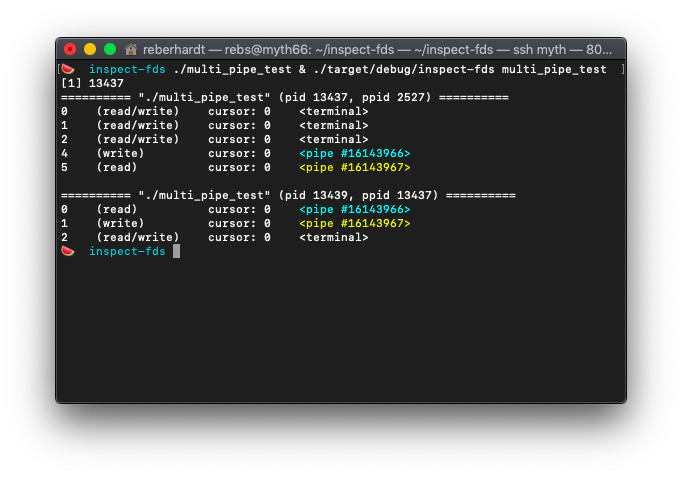
The pipes will be color coded so that it is easier to identify file descriptors that point to the same pipe (in this example, parent fd 4 writes to the pipe that child fd 0 reads from, and parent fd 5 reads from the pipe that child fd 1 writes to).
This tool is especially helpful for debugging mistakes in CS 110 assignment
4, in which you implement a shell. Shells do pretty complicated rewiring of the
file descriptor table in order to create pipelines of processes of arbitrary
length, and in order to read/write input from/to files on disk. Here is what
the file descriptor tables should look like when the assignment 4 shell runs
sleep 100 < /tmp/testinput | sort | wc > /tmp/testoutput. (This is a useless
command, but we put sleep 100 there in order to keep the pipeline running
while we go to run inspect-fds in the other terminal.)
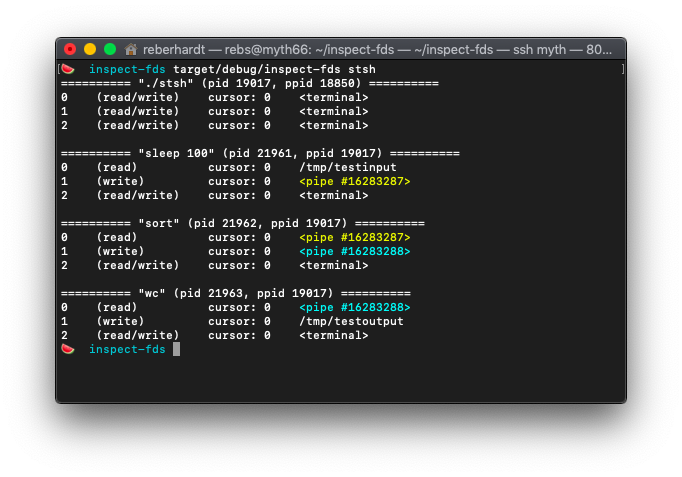
Here, you can see sleep 100 is getting its input from /tmp/testinput and is
writing output to a pipe, which is connected to stdin for sort, whose output
goes to a second pipe, connected to stdin for wc, whose final output is
written to /tmp/testoutput.
You could try this on [bash]((https://en.wikipedia.org/wiki/Bash_(Unix_shell)), the program
associated with the Unix shell, for a similar result!
Implementing this tool involves a lot of file I/O (input/output), which will give you excellent practice with error handling. I think I/O is probably the absolute worst when it comes to error handling – a lot can go wrong! –, so if you can put up with this, you can put up with anything. This exercise will also give you practice working with structs.
I hope that throughout the process, you have fun with it, learn a bit about how Linux works, and build yourself a tool that you could actually use in CS 110 (if you’re taking it) for the next few weeks!
Running the code
Unfortunately, you need to run this tool on a Linux computer, because Mac and Windows don’t use the same API for providing information about processes.
If you’re on Linux and have Rust installed, you’re good to go. If you’re on Mac or Windows, you have two or three options:
- Develop on the
mythmachines.- VSCode has an excellent SSH plugin, and Ryan has a video here on how to configure it for the myths. Other editors should have remote editing functionality as well.
- Use Docker to run your code locally. Docker is a popular tool that creates consistent environments to develop/test/deploy software in. (C Playground runs each program in a Docker container!)
- On Windows, you might be able to do this using WSL 2, which is essentially a fancy Linux virtualization layer. We haven’t tested this, so if you try it, please let us know how it goes.
Getting rust-analyzer on myth
In the week 2 exerieses, I mentioned that rust-analyzer is an awesome plugin for Rust development.
I also mentioned clippy, a Rust linter that can improve the style of your code.
Turns out that neither of them worked on myth. Until this is resolved, you should be able to manually
install a newer version of Rust, which will hopefully let you use tools like rust-analyzer and clippy.
If you’d like to do this, run the following on myth:
  🍉 curl --proto '=https' --tlsv1.2 -sSf https://sh.rustup.rs -o rustup.sh
  🍉 chmod +x rustup.sh
  🍉 ./rustup.sh -y
  🍉 echo "source ~/.cargo/env" >> ~/.bash_profile
  🍉 source ~/.cargo/env
(You’ll get a warning and maybe an error saying that Rust is already installed, but you can ignore that — you should see some things downloaded.) After doing this, rust-analyzer in VSCode (and other editors) should work, as should some other tools like .
Using Docker
Installing Docker
On Mac, you can download and install Docker here. Easy peasy.
On Windows, there are a few ways to install. Instructions are available here.
Building the Docker image
cd into the inspect-fds/ directory, and then run docker build:
docker build -t inspect-fds ./
This will build an inspect-fds image containing dependencies needed to run
your program. This might take a while. (In our case, the dependencies are just
a barebones version of Ubuntu, cargo, and make.)
Once you build this image, you won’t need to do it again!
Running cargo
Once the image is built, you can run your code. Normally, Docker is used with
docker run commands, but there are a lot of arguments that you need to pass.
Instead of asking you to write those out, we included a mini script that does
the docker run part for you. You can run it like this:
./container make
./container cargo build
./container cargo run
You can edit code locally on your machine using whatever editor you like and
run the ./container command to run your code.
Before you start: Build the sample C programs
There are a few sample C programs included that are used as tests. Before you
start working, run make (or, if you’re using Docker, run
./container make).
Milestone 1: Getting the target process
Someone using your program would specify the process to inspect using a command line argument. For example, if they wanted to inspect bash, they can inspect it like so:
cargo run bash
(Remember: cargo run is how we build and run a Rust program from its root directory. Following this are command line arguments – here, just bash –, which are placed into argv when main is called. Bash is a program associated with the Unix shell.)
Our first order of business is to get information about the process the user wants to inspect.
Open src/ps_utils.rs and quicky skim the code that is provided to you.
- We have written some functions to call
psandpgrep, which allow us to get information about processes by PID or by command name, respectively. - There is a lot of semi-complicated error handling in this file (as there often is when dealing with I/O), so it may be helpful to read as an example.
- You won’t need to modify anything in this file
for this assignment, but you will need to call
get_target.
Next, open src/main.rs. You’ll see that we have declared a target variable
containing the first argument in argv. Use the ps_utils::get_target
(you’ll need to specify ps_utils::, the name of the module) function from the
previous file to search for the target process.
- If
get_targetreturns anErr, provide some error message about there being a problem callingpsorpgrepand kill the program. - If
get_targetreturnsNone, you should print an error message about there not being any matching process and callstd::process::exit(1). - Otherwise, print out the found process’s PID.
There are lots of different ways to do this, but here are some things that I found helpful:
matchforOption, as in thefeeling_lucky()example from the lecture notes here.expect. Remember that you can provide an error message as an argument toexpect. (Note, also, that you can’t use the?operator here. Why not? Check out the end of the section on the?operator in the lecture notes linked above.)- The
read_fileexample in the same lecture notes, which usesmatchto conditionally store data in a variable. println!formatting outlined in the Rust docs.- Try not to make something
mutunless you actually need it to bemut.
Here is our output (which you are not required to match). As a reminder, if
you’re using Docker, remember to prefix these commands with ./container.
🍉  cargo run bash
    Finished dev [unoptimized + debuginfo] target(s) in 0.58s
     Running `target/debug/inspect-fds bash`
Found pid 18042
🍉  cargo run nonexistent
    Finished dev [unoptimized + debuginfo] target(s) in 0.72s
     Running `target/debug/inspect-fds nonexistent`
Target "nonexistent" did not match any running PIDs or executables
As a convenience, we have also provided tests that run your program, checking
the exit code. (They don’t verify that your program prints anything in
particular!) You can run cargo test exit_status -- --nocapture --test-threads=1:
🍉  cargo test exit_status -- --nocapture --test-threads=1
    Finished dev [unoptimized + debuginfo] target(s) in 0.53s
     Running target/debug/deps/inspect_fds-41ab7dbb115eafda

running 2 tests
test test::test_exit_status_invalid_target ... Target "./nonexistent" did not match any running PIDs or executables
ok
test test::test_exit_status_valid_target ... Found pid 18306
ok

test result: ok. 2 passed; 0 failed; 0 ignored; 0 measured; 3 filtered out
(Again, if using Docker, don’t forget to prefix with ./container.)
Edit 1/29: if you try to run cargo test at any point and get an “Exec format error”, this isn’t your fault – it shows up for some people, and we’re changing the starter code for the future to avoid it. To fix: go into each of the .c files (e.g., multi_pipe_test.c) and add int argc, char **argv as parameters to main (in these files, main takes no arguments). Re-run make, and the error should go away. Huge shoutout to Cody for figuring this out!
Milestone 2: Printing process info
A note: if you’re starting this before Monday, 1/24, we haven’t talked about structs and methods for structs yet, which are required starting in this milestone. This handout should walk you through what you need, and you can check out the Rust book if you need supplement. But, if it’s confusing, just know that we’ll talk about this syntax on Monday.
Let’s start printing out some more information about these processes. First, in
src/process.rs, let’s add a print() method to the Process struct.
Defining a method (as part of a struct) is a lot like defining a normal
function. Because we want this method to be part of Process, we put it inside
of the impl Process {} block:
impl Process {
    // Other methods that are already defined...

    fn print() {
    }
}
There are two more things we need to do. First, we should add pub to the
method definition to make it “public” (callable by other parts of our
codebase, outside of this single class). In Rust, methods are private by default,
meaning they can only be called by other methods in the same class.
Since we will eventually want to call this method from our main() function,
we mark it as pub.
Second, this method should take &self as a parameter. In Rust, self refers
to the current instance (e.g. if you write proc.print() somewhere, then
print() will be invoked with the proc object as the self parameter). This
is similar to this in Java/C++ and self in Python. When implementing the
print method, you can get the process’s PID as self.pid, PPID as
self.ppid, and so on.
Your function will print details about this process. For now, print out the command name, pid, and ppid in a format that is something like this:
========== "bash" (pid 18042, ppid 17996) ==========
You are welcome to format your output however you like.
Once you have implemented this method, go back to main and call your method
on the Process object that you got in the previous milestone (e.g.
proc.print()). Run your program (or use the cargo test command from the
previous milestone) to ensure it is printing as you expect.
Milestone 3: Listing file descriptors
Let’s get into the meat of this program!
The Linux operating system exposes some information from the kernel through the
/proc filesystem. Files and
directories under /proc do not actually exist on disk; instead, they are
generated by the kernel on demand whenever you read them. You can see a
“directory” for each pid in /proc, and you can list each process’s file
descriptors by examining the directory /proc/{pid}/fd. For example,
inspecting zsh’s file descriptors (you would see a different result if you
are running bash):
# Prefix "ls" with "./container" if you're using Docker
🍉  ls /proc/$$/fd     # $$ is a shell variable containing your current shell's pid
0  1  10  11  12  14  2
In this milestone, we will implement Process::list_fds, which lists the
contents of /proc/{pid}/fd to get the file descriptor numbers that the
process has open.
Open src/process.rs and have a look at the list_fds method. This function
will return a list of file descriptor numbers (Vec<usize>) if the file
descriptor table is available; otherwise, it will return None. It is
important to handle the case of missing file descriptor tables for the purposes
of handling zombie processes, which are processes that have exited but have
not yet been reaped by their parents (i.e. their parents have not yet called
waitpid on them). The processes still exist in the process table, but most of
their resources have been freed, including the file descriptor table.
To implement this function, you should use fs::read_dir(path) to open the
directory. Then, iterate over the
directory entries, parse the file names as usize, and build a vector of file
descriptor numbers. Here are some helpful hints:
- The
format!macro will be useful for constructing the target path.format!is invoked exactly likeprintln!, but instead of printing a formatted string, it returns a formatted string. - Your function should not panic. That means you shouldn’t call
unwrap()orexpect()anywhere. Errors are anticipated in this function, and if they occur, you should returnNone. - When doing file I/O – even just within this small task – you will encounter many
functions that return a
Result. As mentioned above, if you encounter anErr, you should simply returnNone, as this indicates the file descriptor table is unavailable. Here is a nice syntactical shortcut to make this slightly more pleasant:let some_var = something_that_returns_result().ok()?;- The
Result::ok()function converts aResultto anOption.- It returns
Some(val)if theResultwasOk(val), - …or
Noneif theResultwasErr(some_error).
- It returns
- Then, the
?operator unwraps theOption:- It returns
valif theOptionwasSome(val), - …and makes the calling function return
Noneif theOptionwasNone. - We’ve encountered
?more commonly withResults, but you can use it in a similar way forOptions as of (I think) Rust 1.22.
- It returns
- The
fs::read_diris from Rust’s standard library, and the documentation for it is here. The first example may be helpful for seeing how to read a directory. Note that their function returnsResultand ours returnsOption, so you will want to adopt the usage of.ok()?as explained in the previous bullet point.- Iterating with the directory iterator returned by
fs::read_dir(path).ok()?will give you instances ofResult<DirEntry>. Check outDirEntry’s documentation for helpful functions, like how to get the “file” name of the directory entry. - Remember that the Rust documentation is interactive, and you can click on links to
look up
structdefinitions, functions, types, etc.- For example, you might end up using a function that
doc.rust-lang.orgtells you returnsResult<SomeFakeNewType>. Click onSomeFakeNewTypeto go to the relevant docs!
- For example, you might end up using a function that
- Don’t forget to wrap your return, if any, in
Some.
When you have implemented this function, modify your print() function to call
list_fds(), loop over each file descriptor, and print each one. (If list_fds returns
none, print out a helpful error message.) Try running
your program, and make sure it produces the output you expect. You can also run
the provided tests:
cargo test list_fds
(If using Docker, don’t forget to prefix with ./container.)
Milestone 4: Printing additional open file information
Let’s take a closer look at /proc/{pid}/fd:
🍉  ls -l /proc/$$/fd
total 0
lrwx------ 1 rebs operator 64 Apr 22 15:13 0 -> /dev/pts/38
lrwx------ 1 rebs operator 64 Apr 22 15:13 1 -> /dev/pts/38
lrwx------ 1 rebs operator 64 Apr 22 15:13 10 -> /dev/pts/38
lr-x------ 1 rebs operator 64 Apr 22 15:13 11 -> /dev/urandom
lrwx------ 1 rebs operator 64 Apr 22 15:13 12 -> socket:[17099833]
lr-x------ 1 rebs operator 64 Apr 22 15:13 14 -> /usr/share/zsh/functions/Completion.zwc
lrwx------ 1 rebs operator 64 Apr 22 15:13 2 -> /dev/pts/38
(If you’re using Docker, prefix ls with ./container, or run
./container bash to get a Linux shell that you can run multiple commands in.)
Each file in this directory is a symbolic link pointing to whatever file the
file descriptor points to in the vnode table. Above, you can see that file
descriptors 0, 1, and 2 point to /dev/pts/38, which is the file that is
mapped to the terminal I currently have open. File descriptor 12 points to a
socket, which is like a pipe for connecting to the Internet.
We can get additional information about each file descriptor from
/proc/{pid}/fdinfo/{fd}:
🍉  cat /proc/$$/fdinfo/0
pos:	0
flags:	0100002
mnt_id:	22
This tells us the cursor (pos), as well as flags set on the open file table entry
(which includes flags like O_RDONLY, O_WRONLY, O_WRONLY).
Open src/open_file.rs and skim the code that is in this file. In this
milestone, you will need to implement OpenFile::from_fd:
- First, get the name you want to print for the open file that the file descriptor points to.
- Use
fs::read_link, which reads the destination path that the/proc/{pid}/fd/{fd}symbolic link points to. This will give you the name of the open file that the file descriptor points to. - This name will include some OS jargon that we don’t want (for example, we want to print
terminalinstead of/dev/pts/x). So, you should pass the path (as a string – seePathBuf::to_str()) toOpenFile::path_to_nameto get a more human-friendly name for the file. - As in the previous milestone, you’ll want to use
.ok()?to returnNoneif the file can’t be read (presumably because the file descriptor table is no longer available – the process may have just exited).
- Use
- Next, get additional information – cursor and access mode – from the corresponding
fdinfofile.- Use
fs::read_to_stringto read the contents of/proc/{pid}/fdinfo/{fd}. - Pass this to
OpenFile::parse_cursorto extract the cursor from the file. - Pass this to
OpenFile::parse_access_modeto extract the mode from the file. - Note: be careful to read
/proc/{pid}/**fdinfo**/{fd}, not/proc/{pid}/**fd**/{fd}!- See the explanation of
fdinfoandfdfiles above. You should callread_linkonfd/to see where the file descriptor points to, but if you callread_to_stringonfd/, it will follow the symbolic link and try reading the file that the fd points to. When it tries to read/proc/{pid}/fd/0, that is going to attempt to read from/dev/pts/38, which is the terminal “file”, effectively trying to read from stdin. This will cause your program to hang. In contrast,/proc/{pid}/fdinfo/0is a regular file that you can read to get information about fd 0.
- See the explanation of
- Use
- Return a new
OpenFilestruct with the name, cursor, and access mode you extracted.
You can use the supplied tests to check your work:
cargo test openfile_from_fd
(If using Docker, don’t forget to prefix with ./container.)
Once you have implemented this function, open process.rs again and go to your
Process::print function. Instead of iterating over self.list_fds(), use
self.list_open_files() to get the file descriptors along with the
corresponding OpenFiles. You can use the following code to print file
descriptors, although you are welcome to write your own if you like:
match self.list_open_files() {
    None => println!(
        "Warning: could not inspect file descriptors for this process! \
            It might have exited just as we were about to look at its fd table, \
            or it might have exited a while ago and is waiting for the parent \
            to reap it."
    ),
    Some(open_files) => {
        for (fd, file) in open_files {
            println!(
                "{:<4} {:<15} cursor: {:<4} {}",
                fd,
                format!("({})", file.access_mode),
                file.cursor,
                file.colorized_name(),
            );
        }
    }
}
When this is done, your inspect-fds should be looking pretty good! Try it out:
🍉  cargo run bash
    Finished dev [unoptimized + debuginfo] target(s) in 1.16s
     Running `target/debug/inspect-fds bash`
========== "bash" (pid 19018, ppid 18803) ==========
0    (read/write)    cursor: 0    <terminal>
1    (read/write)    cursor: 0    <terminal>
2    (read/write)    cursor: 0    <terminal>
3    (read)          cursor: 0    /dev/urandom
4    (read/write)    cursor: 0    socket:[16103476]
255  (read/write)    cursor: 0    <terminal>

🍉  ./zombie_test & cargo run zombie_test
[1] 20630
    Finished dev [unoptimized + debuginfo] target(s) in 1.09s
     Running `target/debug/inspect-fds zombie_test`
========== "./zombie_test" (pid 20630, ppid 18509) ==========
0    (read/write)    cursor: 0    <terminal>
1    (read/write)    cursor: 0    <terminal>
2    (read/write)    cursor: 0    <terminal>
4    (write)         cursor: 0    <pipe #16102316>
If using Docker, don’t forget to prefix with ./container. For the second test
listed above, you should run it like this:
./container bash -c "./zombie_test & cargo run zombie_test"
Milestone 5: Inspecting child processes
For this tool to be most useful in debugging file descriptor issues (such as how pipes are wired up), we don’t want to only show information about one process; we should also show information about other related processes. For our purposes, let’s print the user-specified process along with all its child processes.
This involves a simple modification to your code in main.rs. After printing
information about the user-specified process, call
ps_utils::get_child_processes to get a list of child processes (again, it’s
acceptable to call expect() here). Iterate over these processes, and call
your print function on each of them.
Your output should look something like this:
🍉  ./zombie_test & cargo run zombie_test
[1] 20630
    Finished dev [unoptimized + debuginfo] target(s) in 1.09s
     Running `target/debug/inspect-fds zombie_test`
========== "./zombie_test" (pid 20630, ppid 18509) ==========
0    (read/write)    cursor: 0    <terminal>
1    (read/write)    cursor: 0    <terminal>
2    (read/write)    cursor: 0    <terminal>
4    (write)         cursor: 0    <pipe #16102316>

========== "[zombie_test] <defunct>" (pid 20632, ppid 20630) ==========
Warning: could not inspect file descriptors for this process! It might have exited just as we were about to look at its fd table, or it might have exited a while ago and is waiting for the parent to reap it.

🍉  ./multi_pipe_test & cargo run multi_pipe_test
[1] 4060
    Finished dev [unoptimized + debuginfo] target(s) in 1.04s
     Running `target/debug/inspect-fds multi_pipe_test`
========== "./multi_pipe_test" (pid 4060, ppid 18509) ==========
0    (read/write)    cursor: 0    <terminal>
1    (read/write)    cursor: 0    <terminal>
2    (read/write)    cursor: 0    <terminal>
4    (write)         cursor: 0    <pipe #16301201>
5    (read)          cursor: 0    <pipe #16301202>

========== "./multi_pipe_test" (pid 4062, ppid 4060) ==========
0    (read)          cursor: 0    <pipe #16301201>
1    (write)         cursor: 0    <pipe #16301202>
2    (read/write)    cursor: 0    <terminal>
If you’re using Docker, you’ll need to run this instead:
./container bash -c "./zombie_test & cargo run zombie_test"
./container bash -c "./multi_pipe_test & cargo run multi_pipe_test"
That’s it! You’re done! You’ll be able to use this tool to debug your CS 110 assignment 3 and assignment 4 code.
Submitting your work
As with last week, you can commit your progress using git:
git commit -am "Type some title here to identify this snapshot!"
In order to submit your work, commit it, then run git push. This will upload
your commits (snapshots) to Github, where we can access them.
If you’re new to GitHub, please verify that your code is submitted by visiting https://github.com/cs110l/week3-yourSunetid. You should be able to see all of your code there.
Grading
Each milestone will be worth 20%. You’ll earn the full credit for each piece if I can see that you’ve made a good-faith effort to complete it.