2012-09-14
Additional charts
Host zm08.stanford.edu: Total CPU
avg(user) = 1.20 avg(sys) = 0.21 avg(idle) = 98.23 avg(iowait) = 0.03 avg(nice) = 0.30 avg(irq) = 0.00 avg(softirq) = 0.00

Host zm08.stanford.edu: Process CPU
avg(mailbox) = 0.00 avg(mysql) = 0.00 avg(stats) = 0.00

Host zm08.stanford.edu: Process Total Memory
avg(mailbox) = 0.00 avg(mysql) = 21763.30 avg(stats) = 0.00

Host zm08.stanford.edu: Process Resident Memory
avg(mailbox) = 0.00 avg(mysql) = 7066.46 avg(stats) = 0.00

Host zm08.stanford.edu: Virtual Memory
avg(swapped) = 0.00 avg(free) = 1278.12 avg(active) = 14548.50 avg(inactive) = 14839.97 avg(page cache) = 17380.77

Host zm08.stanford.edu: Context Switches
avg(context switches) = 272.94

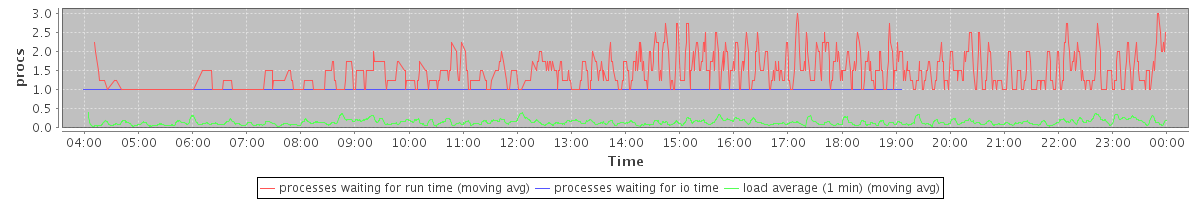
Host zm08.stanford.edu: Run/Blocked Process Queue Size, Load Average
avg(processes waiting for run time) = 0.58 avg(processes waiting for io time) = 0.00 avg(load average (1 min)) = 0.14
Host zm08.stanford.edu: Disk Utilization (Top 10 avg)
avg(dm-2) = 0.00 avg(dm-0) = 0.23 avg(dm-3) = 0.00 avg(dm-1) = 0.00

Host zm08.stanford.edu: Disk Throughput: /dev/dm-2
avg(dm-2 read) = 0.00 avg(dm-2 write) = 0.00

Host zm08.stanford.edu: Disk Throughput: /dev/dm-0
avg(dm-0 read) = 0.64 avg(dm-0 write) = 11.71

Host zm08.stanford.edu: Disk Throughput: /dev/dm-1
avg(dm-1 read) = 0.00 avg(dm-1 write) = 0.01

Host zm08.stanford.edu: Disk IOPs: /dev/dm-2
avg(dm-2 read) = 0.00 avg(dm-2 write) = 0.00

Host zm08.stanford.edu: Disk IOPs: /dev/dm-0
avg(dm-0 read) = 0.16 avg(dm-0 write) = 1.22

Host zm08.stanford.edu: Disk IOPs: /dev/dm-1
avg(dm-1 read) = 0.00 avg(dm-1 write) = 0.00

Host zm08.stanford.edu: Disk Usage
avg(/usr/vice/cache) = 11.00 avg(/opt/zimbra/store) = 29.00 avg(/opt/zimbra) = 42.00 avg(/opt/zimbra/hsm1) = 70.00 avg(/) = 13.00 avg(/opt/zimbra/redolog) = 3.00

Host zm08.stanford.edu: Open file descriptor count
avg(total system file descriptors open) = 3477.78 avg(mailboxd file descriptors open) = 0.00

Host zm08.stanford.edu: Process CPU Time (Top 10 avg)
avg(mysqld) = 2.25 avg(zmstatctl) = 2.00 avg(zmstat-convertd) = 1.73 avg(tripwire) = 2048.00 avg(java) = 24.62 avg(zmcontrol) = 5.77 avg(zmjava) = 1.15 avg(zmstatuslog) = 2.05 avg(zmstat-allprocs) = 5.69 avg(find) = 74.83

Host zm08.stanford.edu: MySQL: InnoDB Buffer Pool Pages
avg(pages read) = 351797.00 avg(pages written) = 671914.00

Host zm08.stanford.edu: MySQL: Tables Open/Opened
avg(open_tables) = 966.00 avg(opened_tables (cumulative)) = 973.00

Host zm08.stanford.edu: MySQL: Total Slow Queries Count
avg(slow queries (cumulative)) = 606.00

Host zm08.stanford.edu: convertd: CPU time used
avg(total cputime) = 0.00 avg(user time) = 0.00 avg(system time) = 0.00

Host zm08.stanford.edu: convertd: Resident Memory
avg(convertd rss) = 122.01

Host zm08.stanford.edu: convertd: Processes and Threads
avg(processes) = 6.00 avg(threads) = 6.00

No data available for the following charts:
Host zm08.stanford.edu: Swap Activity
Host zm08.stanford.edu: Disk Throughput: /dev/dm-3
Host zm08.stanford.edu: Disk IOPs: /dev/dm-3
Host zm08.stanford.edu: SOAP: Invocation Count: Summary (Top 10 max)
Host zm08.stanford.edu: SOAP: Average Call Duration: Summary (Top 10 avg)
Host zm08.stanford.edu: MySQL: InnoDB Buffer Pool Hit Rate
Host zm08.stanford.edu: MySQL: Database Connections In Use
Host zm08.stanford.edu: Mailboxd: Connection Pool Get Latency
Host zm08.stanford.edu: Mailboxd: Dirty Lucene Index Writers
Host zm08.stanford.edu: Mailboxd: Lucene IndexWriterCache Hitrate
Host zm08.stanford.edu: Mailboxd: Lucene IO
Host zm08.stanford.edu: Mailboxd: LMTP Delivery Throughput
Host zm08.stanford.edu: Mailboxd: LMTP Delivery Rate
Host zm08.stanford.edu: Mailboxd: Mailbox Add Rate (Delivery Rate)
Host zm08.stanford.edu: Mailboxd: Mailbox Add Latency (Delivery Speed)
Host zm08.stanford.edu: Mailboxd: Request Rate by Client Protocol
Host zm08.stanford.edu: Mailboxd: Response Time by Client Protocol
Host zm08.stanford.edu: Mailboxd: Active Connections by Client Protocol
Host zm08.stanford.edu: Mailboxd: Mailbox Get Count
Host zm08.stanford.edu: Mailboxd: Mailbox Get Latency
Host zm08.stanford.edu: Mailboxd: Mailbox Cache Hit Rate
Host zm08.stanford.edu: Mailboxd: Mailbox Item/Blob Cache Hit Rate
Host zm08.stanford.edu: Mailboxd: Minor Garbage Collection Time
Host zm08.stanford.edu: Mailboxd: Major Garbage Collection Time
Host zm08.stanford.edu: Mailboxd: Minor Garbage Collection Count
Host zm08.stanford.edu: Mailboxd: Major Garbage Collection Count
Host zm08.stanford.edu: Mailboxd: JVM Heap Used
Host zm08.stanford.edu: Mailboxd: JVM Heap Free
Host zm08.stanford.edu: Mailboxd: JVM Permanent Generation and Code Cache
Host zm08.stanford.edu: nginx: CPU time used
Host zm08.stanford.edu: nginx: Resident Memory
Host zm08.stanford.edu: nginx: Processes and Threads