2013-02-12
Additional charts
Host zm10.stanford.edu: Total CPU
avg(user) = 2.35 avg(sys) = 0.67 avg(idle) = 95.91 avg(iowait) = 0.90 avg(nice) = 0.10 avg(irq) = 0.00 avg(softirq) = 0.05

Host zm10.stanford.edu: Process CPU
avg(mailbox) = 1.46 avg(mysql) = 0.43 avg(stats) = 0.00

Host zm10.stanford.edu: Process Total Memory
avg(mailbox) = 22021.61 avg(mysql) = 30142.60 avg(stats) = 0.00

Host zm10.stanford.edu: Process Resident Memory
avg(mailbox) = 9935.70 avg(mysql) = 17987.46 avg(stats) = 0.00

Host zm10.stanford.edu: Swap Activity
avg(swap in) = 0.01 avg(swap out) = 0.01

Host zm10.stanford.edu: Virtual Memory
avg(swapped) = 62.21 avg(free) = 3170.57 avg(active) = 33741.22 avg(inactive) = 9972.01 avg(page cache) = 14323.38

Host zm10.stanford.edu: Context Switches
avg(context switches) = 4312.31

Host zm10.stanford.edu: Run/Blocked Process Queue Size, Load Average
avg(processes waiting for run time) = 1.68 avg(processes waiting for io time) = 0.35 avg(load average (1 min)) = 1.26

Host zm10.stanford.edu: Disk Utilization (Top 10 avg)
avg(dm-2) = 3.20 avg(dm-0) = 3.16 avg(dm-3) = 6.06 avg(dm-1) = 7.95

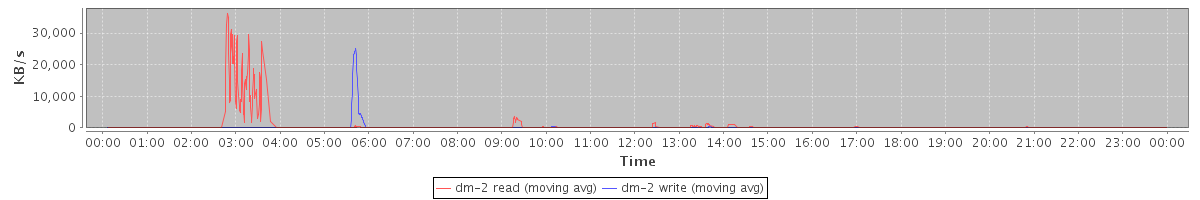
Host zm10.stanford.edu: Disk Throughput: /dev/dm-2
avg(dm-2 read) = 504.07 avg(dm-2 write) = 189.86
Host zm10.stanford.edu: Disk Throughput: /dev/dm-0
avg(dm-0 read) = 113.24 avg(dm-0 write) = 181.54

Host zm10.stanford.edu: Disk Throughput: /dev/dm-3
avg(dm-3 read) = 269.16 avg(dm-3 write) = 207.75

Host zm10.stanford.edu: Disk Throughput: /dev/dm-1
avg(dm-1 read) = 70.70 avg(dm-1 write) = 844.28

Host zm10.stanford.edu: Disk IOPs: /dev/dm-2
avg(dm-2 read) = 9.09 avg(dm-2 write) = 1.15

Host zm10.stanford.edu: Disk IOPs: /dev/dm-0
avg(dm-0 read) = 0.93 avg(dm-0 write) = 11.09

Host zm10.stanford.edu: Disk IOPs: /dev/dm-3
avg(dm-3 read) = 11.34 avg(dm-3 write) = 9.30

Host zm10.stanford.edu: Disk IOPs: /dev/dm-1
avg(dm-1 read) = 6.08 avg(dm-1 write) = 36.48

Host zm10.stanford.edu: Disk Usage
avg(/usr/vice/cache) = 13.32 avg(/opt/zimbra/store) = 21.00 avg(/opt/zimbra) = 18.00 avg(/opt/zimbra/hsm1) = 32.00 avg(/) = 5.01 avg(/opt/zimbra/redolog) = 3.86

Host zm10.stanford.edu: Open file descriptor count
avg(total system file descriptors open) = 6677.55 avg(mailboxd file descriptors open) = 3147.54

Host zm10.stanford.edu: Process CPU Time (Top 10 avg)
avg(tripwire) = 2043.00 avg(updatedb) = 25.05 avg(java) = 1441.35 avg(gzip) = 2020.41 avg(puppetd) = 15.69 avg(mysqld) = 315.36 avg(perl) = 13.20 avg(mysqldump) = 1741.88 avg(zmstat-allprocs) = 15.82 avg(zmcompresslogs) = 1450.50

Host zm10.stanford.edu: SOAP: Invocation Count: Summary (Top 10 max)
max(MsgActionRequest.move) = 1338.00 max(SearchRequest) = 136.00 max(GetContactsRequest) = 908.00 max(MsgActionRequest.delete) = 518.00 max(NoOpRequest) = 191.00 max(GetDomainInfoRequest) = 89.00 max(GetFolderRequest) = 178.00 max(SyncRequest) = 499.00 max(GetEffectiveFolderPermsRequest) = 117.00 max(GetAppointmentRequest) = 874.00

Host zm10.stanford.edu: SOAP: Average Call Duration: Summary (Top 10 avg)
avg(SendMsgRequest) = 239.60 avg(AddAccountAliasRequest) = 258.22 avg(CancelAppointmentRequest) = 238.07 avg(FolderActionRequest.read) = 2319.00 avg(SendInviteReplyRequest) = 345.03 avg(AutoCompleteRequest) = 309.60 avg(ApplyFilterRulesRequest) = 3216.80 avg(SearchGalRequest) = 284.86 avg(FolderActionRequest.empty) = 1030.80 avg(GetQuotaUsageRequest) = 1027.00

Host zm10.stanford.edu: MySQL: InnoDB Buffer Pool Pages
avg(pages read) = 2047250.05 avg(pages written) = 22621838.29

Host zm10.stanford.edu: MySQL: InnoDB Buffer Pool Hit Rate
avg(buffer pool hit rate) = 1000.00

Host zm10.stanford.edu: MySQL: Database Connections In Use
avg(connections in use) = 0.24

Host zm10.stanford.edu: MySQL: Tables Open/Opened
avg(open_tables) = 1198.36 avg(opened_tables (cumulative)) = 71297.87

Host zm10.stanford.edu: MySQL: Total Slow Queries Count
avg(slow queries (cumulative)) = 148364.83

Host zm10.stanford.edu: Mailboxd: Connection Pool Get Latency
avg(mysql) = 0.25 avg(ldap) = 11.40

Host zm10.stanford.edu: Mailboxd: Dirty Lucene Index Writers
avg(dirty index writers) = 37.77

Host zm10.stanford.edu: Mailboxd: Lucene IndexWriterCache Hitrate
avg(cache hitrate) = 31.49

Host zm10.stanford.edu: Mailboxd: Lucene IO
avg(Index writes) = 22.65 avg(Index reads) = 53.01

Host zm10.stanford.edu: Mailboxd: LMTP Delivery Throughput
avg(received) = 79.22 avg(delivered) = 84.59

Host zm10.stanford.edu: Mailboxd: LMTP Delivery Rate
avg(received msgs) = 0.55 avg(delivered msgs) = 0.64 avg(received x rcpts) = 0.71

Host zm10.stanford.edu: Mailboxd: Mailbox Add Rate (Delivery Rate)
avg(mailbox add rate) = 0.81

Host zm10.stanford.edu: Mailboxd: Mailbox Add Latency (Delivery Speed)
avg(mailbox add latency) = 36.24
Host zm10.stanford.edu: Mailboxd: Request Rate by Client Protocol
avg(SOAP) = 10.27 avg(IMAP) = 24.95 avg(POP) = 1.20

Host zm10.stanford.edu: Mailboxd: Response Time by Client Protocol
avg(SOAP) = 20.21 avg(IMAP) = 10.19 avg(POP) = 46.69

Host zm10.stanford.edu: Mailboxd: Active Connections by Client Protocol
avg(IMAP) = 53.69 avg(IMAP SSL) = 490.25 avg(POP) = 0.00 avg(POP SSL) = 0.54 avg(SOAP sessions) = 521.29

Host zm10.stanford.edu: Mailboxd: Mailbox Get Count
avg(mailbox get count) = 2730.00

Host zm10.stanford.edu: Mailboxd: Mailbox Get Latency
avg(mailbox get latency) = 0.01

Host zm10.stanford.edu: Mailboxd: Mailbox Cache Hit Rate
avg(mailbox cache hit rate) = 99.99

Host zm10.stanford.edu: Mailboxd: Mailbox Item/Blob Cache Hit Rate
avg(msg blob cache) = 46.53 avg(item metadata cache) = 34.91

Host zm10.stanford.edu: Mailboxd: Minor Garbage Collection Time
avg(minor GC time) = 0.15

Host zm10.stanford.edu: Mailboxd: Major Garbage Collection Time
avg(major GC time) = 0.00

Host zm10.stanford.edu: Mailboxd: Minor Garbage Collection Count
avg(minor GC count) = 1.67

Host zm10.stanford.edu: Mailboxd: Major Garbage Collection Count
avg(major GC count) = 0.01

Host zm10.stanford.edu: Mailboxd: JVM Heap Used
avg(total) = 4367.96 avg(PS Old Gen) = 0.00 avg(CMS Old Gen) = 3436.95 avg(Tenured Gen) = 0.00 avg(Train Gen) = 0.00 avg(PS Eden Space) = 0.00 avg(PS Survivor Space) = 0.00 avg(Par Eden Space) = 813.27 avg(Par Survivor Space) = 117.74 avg(Eden Space) = 0.00 avg(Survivor Space) = 0.00

Host zm10.stanford.edu: Mailboxd: JVM Heap Free
avg(total free) = 3459.35 avg(PS Old Gen free) = 0.00 avg(CMS Old Gen free) = 2584.05 avg(Tenured Gen free) = 0.00 avg(Train Gen free) = 0.00 avg(PS Eden Space free) = 0.00 avg(PS Survivor Space free) = 0.00 avg(Par Eden Space free) = 792.36 avg(Par Survivor Space free) = 82.94 avg(Eden Space free) = 0.00 avg(Survivor Space free) = 0.00

Host zm10.stanford.edu: Mailboxd: JVM Permanent Generation and Code Cache
avg(PS Perm Gen) = 0.00 avg(Perm Gen) = 0.00 avg(CMS Perm Gen) = 135.00 avg(Code Cache) = 47.51 avg(Perm Gen [shared-ro]) = 0.00 avg(Perm Gen [shared-rw]) = 0.00 avg(PS Perm Gen free) = 0.00 avg(Perm Gen free) = 0.00 avg(CMS Perm Gen free) = 91.78 avg(Code Cache free) = 0.36 avg(Perm Gen [shared-ro] free) = 0.00 avg(Perm Gen [shared-rw] free) = 0.00

Host zm10.stanford.edu: convertd: CPU time used
avg(total cputime) = 0.09 avg(user time) = 0.08 avg(system time) = 0.01

Host zm10.stanford.edu: convertd: Resident Memory
avg(convertd rss) = 134.66

Host zm10.stanford.edu: convertd: Processes and Threads
avg(processes) = 5.85 avg(threads) = 5.86

No data available for the following charts:
Host zm10.stanford.edu: nginx: CPU time used
Host zm10.stanford.edu: nginx: Resident Memory
Host zm10.stanford.edu: nginx: Processes and Threads