2013-04-09
Additional charts
Host zm10.stanford.edu: Total CPU
avg(user) = 2.47 avg(sys) = 0.85 avg(idle) = 95.55 avg(iowait) = 0.97 avg(nice) = 0.10 avg(irq) = 0.00 avg(softirq) = 0.05

Host zm10.stanford.edu: Process CPU
avg(mailbox) = 1.58 avg(mysql) = 0.35 avg(stats) = 0.00

Host zm10.stanford.edu: Process Total Memory
avg(mailbox) = 22509.11 avg(mysql) = 30139.30 avg(stats) = 0.00

Host zm10.stanford.edu: Process Resident Memory
avg(mailbox) = 10197.38 avg(mysql) = 17950.70 avg(stats) = 0.00

Host zm10.stanford.edu: Swap Activity
avg(swap in) = 0.00 avg(swap out) = 0.00

Host zm10.stanford.edu: Virtual Memory
avg(swapped) = 58.33 avg(free) = 2924.61 avg(active) = 33339.28 avg(inactive) = 10589.81 avg(page cache) = 14314.72

Host zm10.stanford.edu: Context Switches
avg(context switches) = 3962.86

Host zm10.stanford.edu: Run/Blocked Process Queue Size, Load Average
avg(processes waiting for run time) = 1.54 avg(processes waiting for io time) = 0.36 avg(load average (1 min)) = 1.38

Host zm10.stanford.edu: Disk Utilization (Top 10 avg)
avg(dm-2) = 2.07 avg(dm-0) = 4.39 avg(dm-3) = 7.63 avg(dm-1) = 9.33

Host zm10.stanford.edu: Disk Throughput: /dev/dm-2
avg(dm-2 read) = 334.07 avg(dm-2 write) = 0.12

Host zm10.stanford.edu: Disk Throughput: /dev/dm-0
avg(dm-0 read) = 135.66 avg(dm-0 write) = 432.72

Host zm10.stanford.edu: Disk Throughput: /dev/dm-3
avg(dm-3 read) = 419.06 avg(dm-3 write) = 214.02

Host zm10.stanford.edu: Disk Throughput: /dev/dm-1
avg(dm-1 read) = 86.10 avg(dm-1 write) = 913.19

Host zm10.stanford.edu: Disk IOPs: /dev/dm-2
avg(dm-2 read) = 6.51 avg(dm-2 write) = 0.01

Host zm10.stanford.edu: Disk IOPs: /dev/dm-0
avg(dm-0 read) = 1.34 avg(dm-0 write) = 14.95

Host zm10.stanford.edu: Disk IOPs: /dev/dm-3
avg(dm-3 read) = 15.50 avg(dm-3 write) = 9.07

Host zm10.stanford.edu: Disk IOPs: /dev/dm-1
avg(dm-1 read) = 6.76 avg(dm-1 write) = 37.95

Host zm10.stanford.edu: Disk Usage
avg(/usr/vice/cache) = 13.10 avg(/opt/zimbra/store) = 30.00 avg(/opt/zimbra) = 19.00 avg(/opt/zimbra/hsm1) = 25.00 avg(/) = 6.00 avg(/opt/zimbra/redolog) = 12.85

Host zm10.stanford.edu: Open file descriptor count
avg(total system file descriptors open) = 6453.81 avg(mailboxd file descriptors open) = 2860.26

Host zm10.stanford.edu: Process CPU Time (Top 10 avg)
avg(tripwire) = 1953.00 avg(updatedb) = 35.90 avg(java) = 1641.80 avg(gzip) = 2129.76 avg(puppetd) = 16.01 avg(mysqld) = 261.56 avg(yum) = 27.00 avg(mysqldump) = 1668.62 avg(zmstat-allprocs) = 15.78 avg(zmcompresslogs) = 1178.50

Host zm10.stanford.edu: SOAP: Invocation Count: Summary (Top 10 max)
max(MsgActionRequest.move) = 2813.00 max(SearchRequest) = 135.00 max(MsgActionRequest.delete) = 1673.00 max(NoOpRequest) = 203.00 max(AddMsgRequest) = 502.00 max(SetAppointmentRequest) = 200.00 max(GetFolderRequest) = 195.00 max(ItemActionRequest.delete) = 952.00 max(SyncRequest) = 554.00 max(GetAppointmentRequest) = 951.00

Host zm10.stanford.edu: SOAP: Average Call Duration: Summary (Top 10 avg)
avg(CreateSignatureRequest) = 325.20 avg(DeleteAccountRequest) = 2216.00 avg(AddAccountAliasRequest) = 357.80 avg(GetInfoRequest) = 330.30 avg(CreateTagRequest) = 354.00 avg(CreateAppointmentExceptionRequest) = 359.53 avg(SendInviteReplyRequest) = 488.49 avg(AutoCompleteRequest) = 378.79 avg(FolderActionRequest.empty) = 417.57 avg(GetQuotaUsageRequest) = 1001.00

Host zm10.stanford.edu: MySQL: InnoDB Buffer Pool Pages
avg(pages read) = 1404232.87 avg(pages written) = 13434587.61

Host zm10.stanford.edu: MySQL: InnoDB Buffer Pool Hit Rate
avg(buffer pool hit rate) = 1000.00

Host zm10.stanford.edu: MySQL: Database Connections In Use
avg(connections in use) = 0.23

Host zm10.stanford.edu: MySQL: Tables Open/Opened
avg(open_tables) = 1198.58 avg(opened_tables (cumulative)) = 45597.07

Host zm10.stanford.edu: MySQL: Total Slow Queries Count
avg(slow queries (cumulative)) = 89140.30

Host zm10.stanford.edu: Mailboxd: Connection Pool Get Latency
avg(mysql) = 0.25 avg(ldap) = 147.34

Host zm10.stanford.edu: Mailboxd: Dirty Lucene Index Writers
avg(dirty index writers) = 39.12

Host zm10.stanford.edu: Mailboxd: Lucene IndexWriterCache Hitrate
avg(cache hitrate) = 31.36

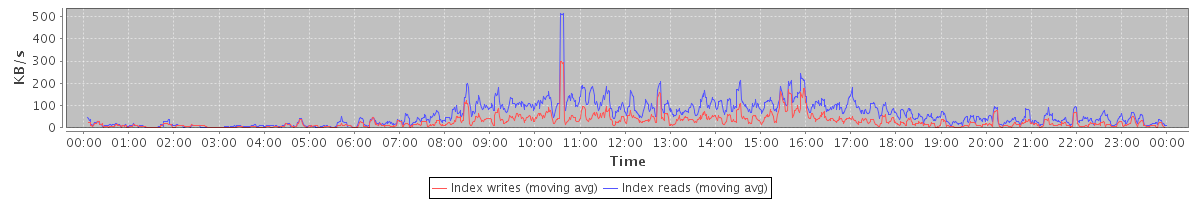
Host zm10.stanford.edu: Mailboxd: Lucene IO
avg(Index writes) = 27.64 avg(Index reads) = 60.10
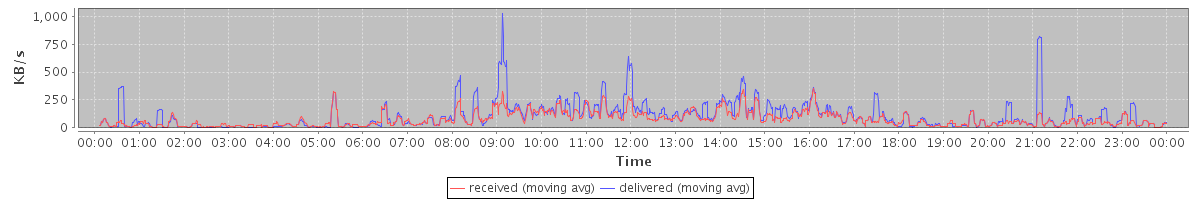
Host zm10.stanford.edu: Mailboxd: LMTP Delivery Throughput
avg(received) = 74.85 avg(delivered) = 104.53
Host zm10.stanford.edu: Mailboxd: LMTP Delivery Rate
avg(received msgs) = 0.57 avg(delivered msgs) = 0.71 avg(received x rcpts) = 0.73

Host zm10.stanford.edu: Mailboxd: Mailbox Add Rate (Delivery Rate)
avg(mailbox add rate) = 1.01

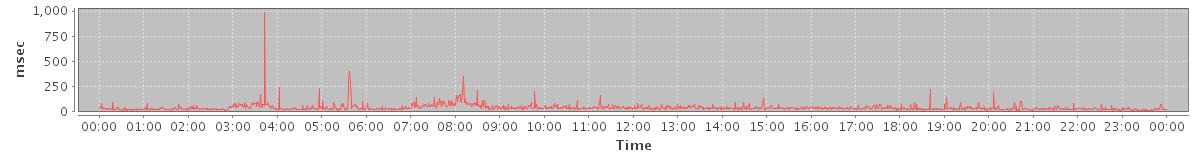
Host zm10.stanford.edu: Mailboxd: Mailbox Add Latency (Delivery Speed)
avg(mailbox add latency) = 40.35
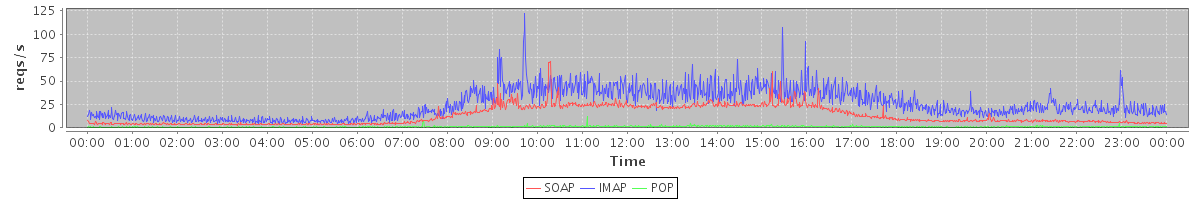
Host zm10.stanford.edu: Mailboxd: Request Rate by Client Protocol
avg(SOAP) = 12.68 avg(IMAP) = 24.99 avg(POP) = 1.12
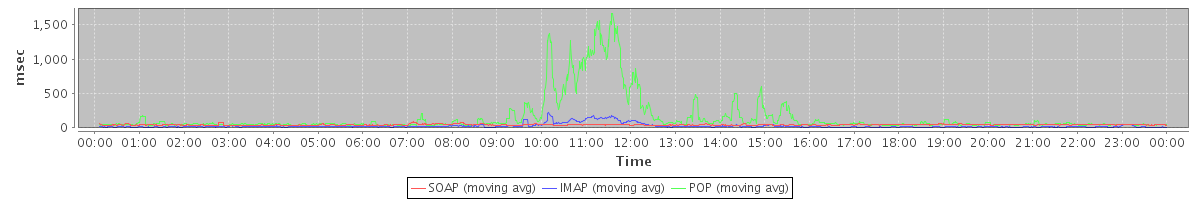
Host zm10.stanford.edu: Mailboxd: Response Time by Client Protocol
avg(SOAP) = 43.86 avg(IMAP) = 25.72 avg(POP) = 154.87
Host zm10.stanford.edu: Mailboxd: Active Connections by Client Protocol
avg(IMAP) = 92.61 avg(IMAP SSL) = 516.25 avg(POP) = 0.01 avg(POP SSL) = 0.73 avg(SOAP sessions) = 530.00

Host zm10.stanford.edu: Mailboxd: Mailbox Get Count
avg(mailbox get count) = 2930.37

Host zm10.stanford.edu: Mailboxd: Mailbox Get Latency
avg(mailbox get latency) = 0.01

Host zm10.stanford.edu: Mailboxd: Mailbox Cache Hit Rate
avg(mailbox cache hit rate) = 100.00

Host zm10.stanford.edu: Mailboxd: Mailbox Item/Blob Cache Hit Rate
avg(msg blob cache) = 48.21 avg(item metadata cache) = 37.94

Host zm10.stanford.edu: Mailboxd: Minor Garbage Collection Time
avg(minor GC time) = 0.16
Host zm10.stanford.edu: Mailboxd: Major Garbage Collection Time
avg(major GC time) = 0.00
Host zm10.stanford.edu: Mailboxd: Minor Garbage Collection Count
avg(minor GC count) = 1.77
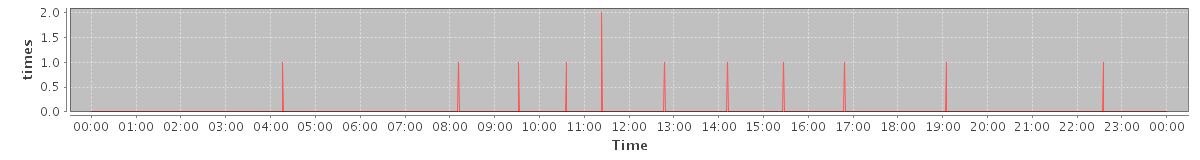
Host zm10.stanford.edu: Mailboxd: Major Garbage Collection Count
avg(major GC count) = 0.01
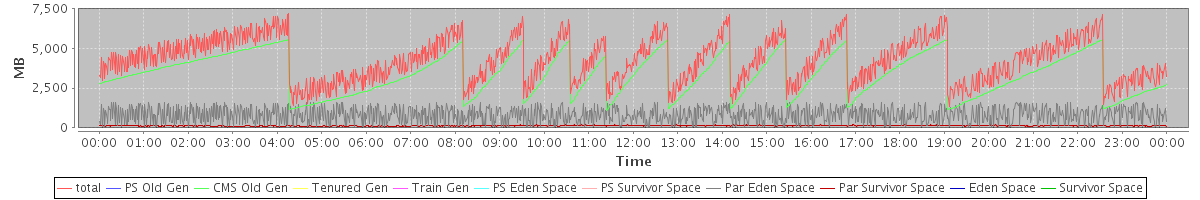
Host zm10.stanford.edu: Mailboxd: JVM Heap Used
avg(total) = 4282.84 avg(PS Old Gen) = 0.00 avg(CMS Old Gen) = 3341.68 avg(Tenured Gen) = 0.00 avg(Train Gen) = 0.00 avg(PS Eden Space) = 0.00 avg(PS Survivor Space) = 0.00 avg(Par Eden Space) = 810.74 avg(Par Survivor Space) = 130.43 avg(Eden Space) = 0.00 avg(Survivor Space) = 0.00
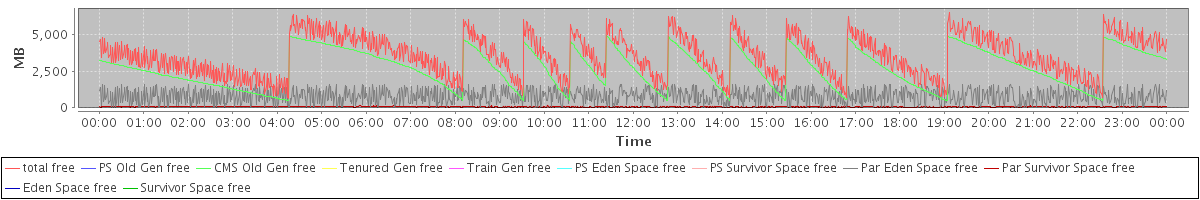
Host zm10.stanford.edu: Mailboxd: JVM Heap Free
avg(total free) = 3544.47 avg(PS Old Gen free) = 0.00 avg(CMS Old Gen free) = 2679.32 avg(Tenured Gen free) = 0.00 avg(Train Gen free) = 0.00 avg(PS Eden Space free) = 0.00 avg(PS Survivor Space free) = 0.00 avg(Par Eden Space free) = 794.89 avg(Par Survivor Space free) = 70.26 avg(Eden Space free) = 0.00 avg(Survivor Space free) = 0.00
Host zm10.stanford.edu: Mailboxd: JVM Permanent Generation and Code Cache
avg(PS Perm Gen) = 0.00 avg(Perm Gen) = 0.00 avg(CMS Perm Gen) = 136.03 avg(Code Cache) = 47.52 avg(Perm Gen [shared-ro]) = 0.00 avg(Perm Gen [shared-rw]) = 0.00 avg(PS Perm Gen free) = 0.00 avg(Perm Gen free) = 0.00 avg(CMS Perm Gen free) = 91.26 avg(Code Cache free) = 0.36 avg(Perm Gen [shared-ro] free) = 0.00 avg(Perm Gen [shared-rw] free) = 0.00

Host zm10.stanford.edu: convertd: CPU time used
avg(total cputime) = 0.13 avg(user time) = 0.12 avg(system time) = 0.01

Host zm10.stanford.edu: convertd: Resident Memory
avg(convertd rss) = 136.76

Host zm10.stanford.edu: convertd: Processes and Threads
avg(processes) = 6.00 avg(threads) = 6.00

No data available for the following charts:
Host zm10.stanford.edu: nginx: CPU time used
Host zm10.stanford.edu: nginx: Resident Memory
Host zm10.stanford.edu: nginx: Processes and Threads