2013-04-13
Additional charts
Host zm10.stanford.edu: Total CPU
avg(user) = 1.51 avg(sys) = 0.41 avg(idle) = 97.37 avg(iowait) = 0.57 avg(nice) = 0.10 avg(irq) = 0.00 avg(softirq) = 0.01

Host zm10.stanford.edu: Process CPU
avg(mailbox) = 0.78 avg(mysql) = 0.18 avg(stats) = 0.00

Host zm10.stanford.edu: Process Total Memory
avg(mailbox) = 22464.48 avg(mysql) = 30139.30 avg(stats) = 0.00

Host zm10.stanford.edu: Process Resident Memory
avg(mailbox) = 10184.61 avg(mysql) = 17979.31 avg(stats) = 0.00

Host zm10.stanford.edu: Swap Activity
avg(swap in) = 0.01 avg(swap out) = 0.00

Host zm10.stanford.edu: Virtual Memory
avg(swapped) = 58.47 avg(free) = 3344.21 avg(active) = 32605.03 avg(inactive) = 10960.92 avg(page cache) = 13770.03

Host zm10.stanford.edu: Context Switches
avg(context switches) = 2421.72

Host zm10.stanford.edu: Run/Blocked Process Queue Size, Load Average
avg(processes waiting for run time) = 1.26 avg(processes waiting for io time) = 0.22 avg(load average (1 min)) = 0.80

Host zm10.stanford.edu: Disk Utilization (Top 10 avg)
avg(dm-2) = 1.91 avg(dm-0) = 1.25 avg(dm-3) = 4.19 avg(dm-1) = 3.94

Host zm10.stanford.edu: Disk Throughput: /dev/dm-2
avg(dm-2 read) = 370.49 avg(dm-2 write) = 27.47

Host zm10.stanford.edu: Disk Throughput: /dev/dm-0
avg(dm-0 read) = 110.87 avg(dm-0 write) = 201.21

Host zm10.stanford.edu: Disk Throughput: /dev/dm-3
avg(dm-3 read) = 317.61 avg(dm-3 write) = 65.26

Host zm10.stanford.edu: Disk Throughput: /dev/dm-1
avg(dm-1 read) = 48.23 avg(dm-1 write) = 446.41

Host zm10.stanford.edu: Disk IOPs: /dev/dm-2
avg(dm-2 read) = 7.35 avg(dm-2 write) = 0.80

Host zm10.stanford.edu: Disk IOPs: /dev/dm-0
avg(dm-0 read) = 1.27 avg(dm-0 write) = 3.98

Host zm10.stanford.edu: Disk IOPs: /dev/dm-3
avg(dm-3 read) = 11.84 avg(dm-3 write) = 4.13

Host zm10.stanford.edu: Disk IOPs: /dev/dm-1
avg(dm-1 read) = 3.62 avg(dm-1 write) = 20.60

Host zm10.stanford.edu: Disk Usage
avg(/usr/vice/cache) = 13.51 avg(/opt/zimbra/store) = 31.00 avg(/opt/zimbra) = 19.62 avg(/opt/zimbra/hsm1) = 25.00 avg(/) = 6.00 avg(/opt/zimbra/redolog) = 14.01

Host zm10.stanford.edu: Open file descriptor count
avg(total system file descriptors open) = 6055.91 avg(mailboxd file descriptors open) = 2343.16

Host zm10.stanford.edu: Process CPU Time (Top 10 avg)
avg(updatedb) = 34.00 avg(java) = 797.68 avg(gzip) = 1993.14 avg(puppetd) = 15.85 avg(mysqld) = 144.75 avg(mysqldump) = 1569.62 avg(zm-admin) = 9.78 avg(zmstat-allprocs) = 15.89 avg(find) = 8.67 avg(zmcompresslogs) = 1296.00

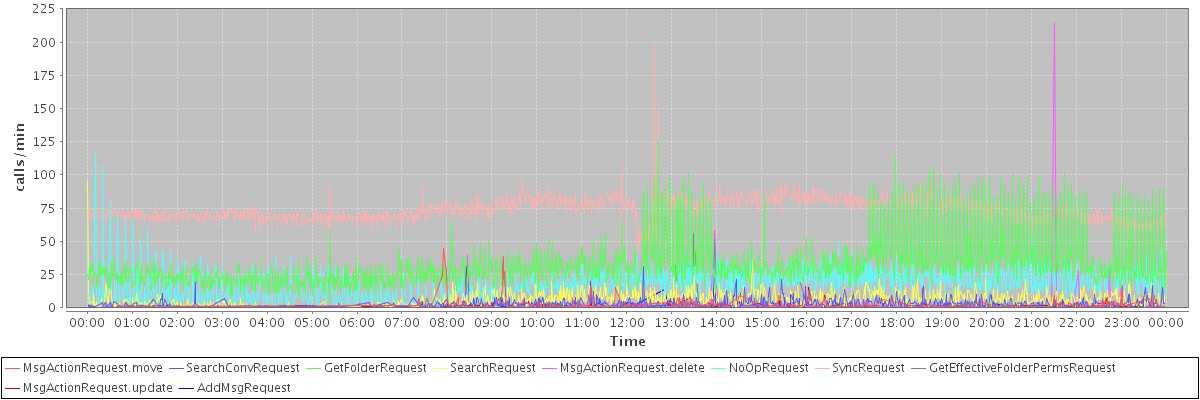
Host zm10.stanford.edu: SOAP: Invocation Count: Summary (Top 10 max)
max(MsgActionRequest.move) = 45.00 max(SearchConvRequest) = 31.00 max(GetFolderRequest) = 125.00 max(SearchRequest) = 96.00 max(MsgActionRequest.delete) = 215.00 max(NoOpRequest) = 117.00 max(SyncRequest) = 199.00 max(GetEffectiveFolderPermsRequest) = 56.00 max(MsgActionRequest.update) = 39.00 max(AddMsgRequest) = 56.00
Host zm10.stanford.edu: SOAP: Average Call Duration: Summary (Top 10 avg)
avg(SendInviteReplyRequest) = 355.00 avg(AutoCompleteRequest) = 400.18 avg(AutoCompleteGalRequest) = 853.00 avg(SearchGalRequest) = 6234.09 avg(BackupQueryRequest) = 298.60 avg(AddAccountAliasRequest) = 265.37 avg(GetInfoRequest) = 373.36 avg(CreateAppointmentExceptionRequest) = 283.00 avg(GetIdentitiesRequest) = 295.57 avg(GetQuotaUsageRequest) = 2364.00

Host zm10.stanford.edu: MySQL: InnoDB Buffer Pool Pages
avg(pages read) = 1433903.43 avg(pages written) = 19286301.24

Host zm10.stanford.edu: MySQL: InnoDB Buffer Pool Hit Rate
avg(buffer pool hit rate) = 999.31
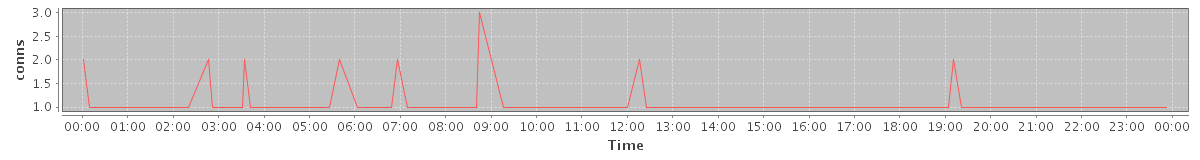
Host zm10.stanford.edu: MySQL: Database Connections In Use
avg(connections in use) = 0.11
Host zm10.stanford.edu: MySQL: Tables Open/Opened
avg(open_tables) = 1198.37 avg(opened_tables (cumulative)) = 62659.83

Host zm10.stanford.edu: MySQL: Total Slow Queries Count
avg(slow queries (cumulative)) = 122147.96

Host zm10.stanford.edu: Mailboxd: Connection Pool Get Latency
avg(mysql) = 0.25 avg(ldap) = 144.11

Host zm10.stanford.edu: Mailboxd: Dirty Lucene Index Writers
avg(dirty index writers) = 13.15

Host zm10.stanford.edu: Mailboxd: Lucene IndexWriterCache Hitrate
avg(cache hitrate) = 20.72

Host zm10.stanford.edu: Mailboxd: Lucene IO
avg(Index writes) = 7.21 avg(Index reads) = 16.72

Host zm10.stanford.edu: Mailboxd: LMTP Delivery Throughput
avg(received) = 24.27 avg(delivered) = 18.45

Host zm10.stanford.edu: Mailboxd: LMTP Delivery Rate
avg(received msgs) = 0.19 avg(delivered msgs) = 0.19 avg(received x rcpts) = 0.24

Host zm10.stanford.edu: Mailboxd: Mailbox Add Rate (Delivery Rate)
avg(mailbox add rate) = 0.22

Host zm10.stanford.edu: Mailboxd: Mailbox Add Latency (Delivery Speed)
avg(mailbox add latency) = 34.20

Host zm10.stanford.edu: Mailboxd: Request Rate by Client Protocol
avg(SOAP) = 3.91 avg(IMAP) = 12.24 avg(POP) = 0.72

Host zm10.stanford.edu: Mailboxd: Response Time by Client Protocol
avg(SOAP) = 64.20 avg(IMAP) = 20.26 avg(POP) = 50.33

Host zm10.stanford.edu: Mailboxd: Active Connections by Client Protocol
avg(IMAP) = 74.27 avg(IMAP SSL) = 377.80 avg(POP) = 0.03 avg(POP SSL) = 0.41 avg(SOAP sessions) = 123.79

Host zm10.stanford.edu: Mailboxd: Mailbox Get Count
avg(mailbox get count) = 1107.34

Host zm10.stanford.edu: Mailboxd: Mailbox Get Latency
avg(mailbox get latency) = 0.04

Host zm10.stanford.edu: Mailboxd: Mailbox Cache Hit Rate
avg(mailbox cache hit rate) = 99.87

Host zm10.stanford.edu: Mailboxd: Mailbox Item/Blob Cache Hit Rate
avg(msg blob cache) = 48.88 avg(item metadata cache) = 35.70

Host zm10.stanford.edu: Mailboxd: Minor Garbage Collection Time
avg(minor GC time) = 0.07

Host zm10.stanford.edu: Mailboxd: Major Garbage Collection Time
avg(major GC time) = 0.00

Host zm10.stanford.edu: Mailboxd: Minor Garbage Collection Count
avg(minor GC count) = 0.79

Host zm10.stanford.edu: Mailboxd: Major Garbage Collection Count
avg(major GC count) = 0.00

Host zm10.stanford.edu: Mailboxd: JVM Heap Used
avg(total) = 4112.55 avg(PS Old Gen) = 0.00 avg(CMS Old Gen) = 3181.64 avg(Tenured Gen) = 0.00 avg(Train Gen) = 0.00 avg(PS Eden Space) = 0.00 avg(PS Survivor Space) = 0.00 avg(Par Eden Space) = 808.85 avg(Par Survivor Space) = 122.06 avg(Eden Space) = 0.00 avg(Survivor Space) = 0.00

Host zm10.stanford.edu: Mailboxd: JVM Heap Free
avg(total free) = 3714.76 avg(PS Old Gen free) = 0.00 avg(CMS Old Gen free) = 2839.36 avg(Tenured Gen free) = 0.00 avg(Train Gen free) = 0.00 avg(PS Eden Space free) = 0.00 avg(PS Survivor Space free) = 0.00 avg(Par Eden Space free) = 796.77 avg(Par Survivor Space free) = 78.63 avg(Eden Space free) = 0.00 avg(Survivor Space free) = 0.00

Host zm10.stanford.edu: Mailboxd: JVM Permanent Generation and Code Cache
avg(PS Perm Gen) = 0.00 avg(Perm Gen) = 0.00 avg(CMS Perm Gen) = 142.76 avg(Code Cache) = 47.52 avg(Perm Gen [shared-ro]) = 0.00 avg(Perm Gen [shared-rw]) = 0.00 avg(PS Perm Gen free) = 0.00 avg(Perm Gen free) = 0.00 avg(CMS Perm Gen free) = 94.88 avg(Code Cache free) = 0.35 avg(Perm Gen [shared-ro] free) = 0.00 avg(Perm Gen [shared-rw] free) = 0.00

Host zm10.stanford.edu: convertd: CPU time used
avg(total cputime) = 0.02 avg(user time) = 0.02 avg(system time) = 0.00

Host zm10.stanford.edu: convertd: Resident Memory
avg(convertd rss) = 145.90

Host zm10.stanford.edu: convertd: Processes and Threads
avg(processes) = 5.99 avg(threads) = 6.00

No data available for the following charts:
Host zm10.stanford.edu: nginx: CPU time used
Host zm10.stanford.edu: nginx: Resident Memory
Host zm10.stanford.edu: nginx: Processes and Threads