2013-04-18
Additional charts
Host zm10.stanford.edu: Total CPU
avg(user) = 2.68 avg(sys) = 0.83 avg(idle) = 95.60 avg(iowait) = 0.73 avg(nice) = 0.10 avg(irq) = 0.00 avg(softirq) = 0.04

Host zm10.stanford.edu: Process CPU
avg(mailbox) = 1.80 avg(mysql) = 0.33 avg(stats) = 0.00

Host zm10.stanford.edu: Process Total Memory
avg(mailbox) = 22944.23 avg(mysql) = 30142.70 avg(stats) = 0.00

Host zm10.stanford.edu: Process Resident Memory
avg(mailbox) = 10621.37 avg(mysql) = 18029.83 avg(stats) = 0.00

Host zm10.stanford.edu: Swap Activity
avg(swap in) = 0.00 avg(swap out) = 0.00

Host zm10.stanford.edu: Virtual Memory
avg(swapped) = 58.60 avg(free) = 3226.15 avg(active) = 33438.29 avg(inactive) = 10233.50 avg(page cache) = 13565.82

Host zm10.stanford.edu: Context Switches
avg(context switches) = 3616.54

Host zm10.stanford.edu: Run/Blocked Process Queue Size, Load Average
avg(processes waiting for run time) = 1.64 avg(processes waiting for io time) = 0.26 avg(load average (1 min)) = 1.32

Host zm10.stanford.edu: Disk Utilization (Top 10 avg)
avg(dm-2) = 1.52 avg(dm-0) = 3.40 avg(dm-3) = 5.99 avg(dm-1) = 8.15

Host zm10.stanford.edu: Disk Throughput: /dev/dm-2
avg(dm-2 read) = 222.14 avg(dm-2 write) = 0.38

Host zm10.stanford.edu: Disk Throughput: /dev/dm-0
avg(dm-0 read) = 145.63 avg(dm-0 write) = 404.82

Host zm10.stanford.edu: Disk Throughput: /dev/dm-3
avg(dm-3 read) = 313.56 avg(dm-3 write) = 214.16

Host zm10.stanford.edu: Disk Throughput: /dev/dm-1
avg(dm-1 read) = 83.31 avg(dm-1 write) = 872.58

Host zm10.stanford.edu: Disk IOPs: /dev/dm-2
avg(dm-2 read) = 3.59 avg(dm-2 write) = 0.02

Host zm10.stanford.edu: Disk IOPs: /dev/dm-0
avg(dm-0 read) = 1.43 avg(dm-0 write) = 12.44

Host zm10.stanford.edu: Disk IOPs: /dev/dm-3
avg(dm-3 read) = 11.14 avg(dm-3 write) = 9.42

Host zm10.stanford.edu: Disk IOPs: /dev/dm-1
avg(dm-1 read) = 6.63 avg(dm-1 write) = 35.91

Host zm10.stanford.edu: Disk Usage
avg(/usr/vice/cache) = 13.01 avg(/opt/zimbra/store) = 31.37 avg(/opt/zimbra) = 20.00 avg(/opt/zimbra/hsm1) = 25.00 avg(/) = 6.00 avg(/opt/zimbra/redolog) = 15.05

Host zm10.stanford.edu: Open file descriptor count
avg(total system file descriptors open) = 6483.65 avg(mailboxd file descriptors open) = 2771.14

Host zm10.stanford.edu: Process CPU Time (Top 10 avg)
avg(tripwire) = 1817.00 avg(updatedb) = 28.86 avg(java) = 1792.68 avg(gzip) = 2159.50 avg(puppetd) = 16.33 avg(mysqld) = 241.74 avg(perl) = 13.29 avg(mysqldump) = 1480.78 avg(zmstat-allprocs) = 15.97 avg(zmcompresslogs) = 1419.00

Host zm10.stanford.edu: SOAP: Invocation Count: Summary (Top 10 max)
max(MsgActionRequest.move) = 123.00 max(SearchRequest) = 146.00 max(GetContactsRequest) = 434.00 max(MsgActionRequest.delete) = 424.00 max(NoOpRequest) = 179.00 max(GetFolderRequest) = 187.00 max(SyncRequest) = 566.00 max(GetEffectiveFolderPermsRequest) = 143.00 max(GetAppointmentRequest) = 219.00 max(CreateContactRequest) = 770.00

Host zm10.stanford.edu: SOAP: Average Call Duration: Summary (Top 10 avg)
avg(ModifyAppointmentRequest) = 364.71 avg(SendMsgRequest) = 332.66 avg(AddAccountAliasRequest) = 492.59 avg(BackupQueryRequest) = 330.80 avg(GetInfoRequest) = 355.25 avg(CreateAppointmentExceptionRequest) = 970.94 avg(SendInviteReplyRequest) = 579.85 avg(AutoCompleteRequest) = 469.83 avg(FolderActionRequest.empty) = 382.72 avg(GetQuotaUsageRequest) = 1216.00

Host zm10.stanford.edu: MySQL: InnoDB Buffer Pool Pages
avg(pages read) = 1514777.20 avg(pages written) = 26144029.92

Host zm10.stanford.edu: MySQL: InnoDB Buffer Pool Hit Rate
avg(buffer pool hit rate) = 1000.00

Host zm10.stanford.edu: MySQL: Database Connections In Use
avg(connections in use) = 0.20

Host zm10.stanford.edu: MySQL: Tables Open/Opened
avg(open_tables) = 1198.11 avg(opened_tables (cumulative)) = 83925.04

Host zm10.stanford.edu: MySQL: Total Slow Queries Count
avg(slow queries (cumulative)) = 147573.47

Host zm10.stanford.edu: Mailboxd: Connection Pool Get Latency
avg(mysql) = 0.25 avg(ldap) = 156.77

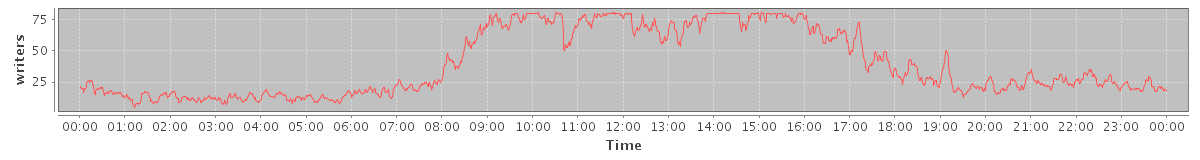
Host zm10.stanford.edu: Mailboxd: Dirty Lucene Index Writers
avg(dirty index writers) = 39.48
Host zm10.stanford.edu: Mailboxd: Lucene IndexWriterCache Hitrate
avg(cache hitrate) = 30.94

Host zm10.stanford.edu: Mailboxd: Lucene IO
avg(Index writes) = 24.17 avg(Index reads) = 53.14

Host zm10.stanford.edu: Mailboxd: LMTP Delivery Throughput
avg(received) = 69.44 avg(delivered) = 83.92

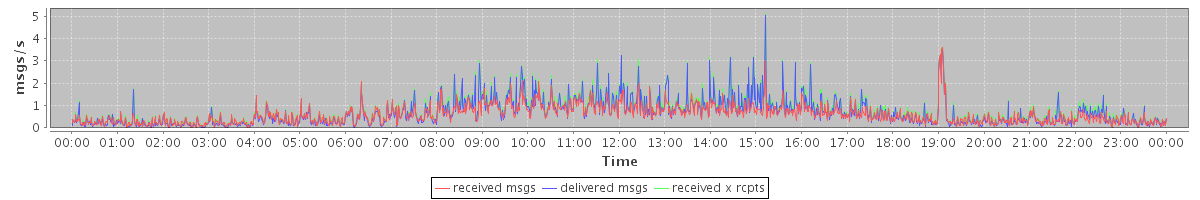
Host zm10.stanford.edu: Mailboxd: LMTP Delivery Rate
avg(received msgs) = 0.59 avg(delivered msgs) = 0.66 avg(received x rcpts) = 0.75
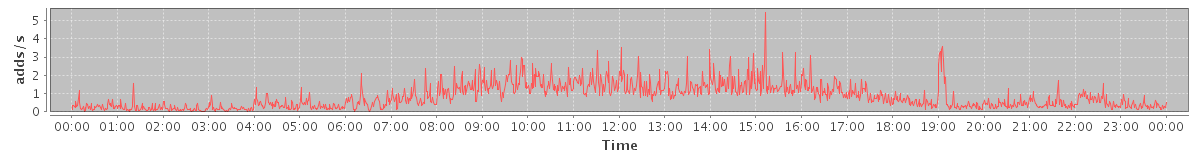
Host zm10.stanford.edu: Mailboxd: Mailbox Add Rate (Delivery Rate)
avg(mailbox add rate) = 0.83
Host zm10.stanford.edu: Mailboxd: Mailbox Add Latency (Delivery Speed)
avg(mailbox add latency) = 42.16

Host zm10.stanford.edu: Mailboxd: Request Rate by Client Protocol
avg(SOAP) = 10.98 avg(IMAP) = 22.27 avg(POP) = 1.19

Host zm10.stanford.edu: Mailboxd: Response Time by Client Protocol
avg(SOAP) = 52.83 avg(IMAP) = 14.65 avg(POP) = 44.53

Host zm10.stanford.edu: Mailboxd: Active Connections by Client Protocol
avg(IMAP) = 85.28 avg(IMAP SSL) = 489.97 avg(POP) = 0.01 avg(POP SSL) = 0.55 avg(SOAP sessions) = 503.79

Host zm10.stanford.edu: Mailboxd: Mailbox Get Count
avg(mailbox get count) = 2558.74

Host zm10.stanford.edu: Mailboxd: Mailbox Get Latency
avg(mailbox get latency) = 0.01

Host zm10.stanford.edu: Mailboxd: Mailbox Cache Hit Rate
avg(mailbox cache hit rate) = 99.99

Host zm10.stanford.edu: Mailboxd: Mailbox Item/Blob Cache Hit Rate
avg(msg blob cache) = 47.02 avg(item metadata cache) = 37.34

Host zm10.stanford.edu: Mailboxd: Minor Garbage Collection Time
avg(minor GC time) = 0.15

Host zm10.stanford.edu: Mailboxd: Major Garbage Collection Time
avg(major GC time) = 0.00

Host zm10.stanford.edu: Mailboxd: Minor Garbage Collection Count
avg(minor GC count) = 1.62

Host zm10.stanford.edu: Mailboxd: Major Garbage Collection Count
avg(major GC count) = 0.01

Host zm10.stanford.edu: Mailboxd: JVM Heap Used
avg(total) = 4521.98 avg(PS Old Gen) = 0.00 avg(CMS Old Gen) = 3588.34 avg(Tenured Gen) = 0.00 avg(Train Gen) = 0.00 avg(PS Eden Space) = 0.00 avg(PS Survivor Space) = 0.00 avg(Par Eden Space) = 802.99 avg(Par Survivor Space) = 130.65 avg(Eden Space) = 0.00 avg(Survivor Space) = 0.00

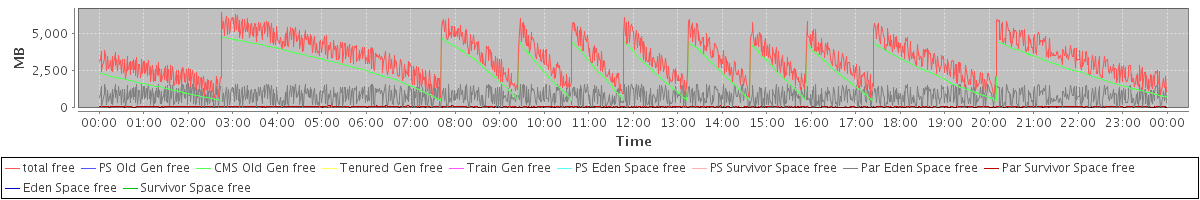
Host zm10.stanford.edu: Mailboxd: JVM Heap Free
avg(total free) = 3305.33 avg(PS Old Gen free) = 0.00 avg(CMS Old Gen free) = 2432.66 avg(Tenured Gen free) = 0.00 avg(Train Gen free) = 0.00 avg(PS Eden Space free) = 0.00 avg(PS Survivor Space free) = 0.00 avg(Par Eden Space free) = 802.64 avg(Par Survivor Space free) = 70.03 avg(Eden Space free) = 0.00 avg(Survivor Space free) = 0.00
Host zm10.stanford.edu: Mailboxd: JVM Permanent Generation and Code Cache
avg(PS Perm Gen) = 0.00 avg(Perm Gen) = 0.00 avg(CMS Perm Gen) = 144.52 avg(Code Cache) = 47.52 avg(Perm Gen [shared-ro]) = 0.00 avg(Perm Gen [shared-rw]) = 0.00 avg(PS Perm Gen free) = 0.00 avg(Perm Gen free) = 0.00 avg(CMS Perm Gen free) = 96.33 avg(Code Cache free) = 0.35 avg(Perm Gen [shared-ro] free) = 0.00 avg(Perm Gen [shared-rw] free) = 0.00

Host zm10.stanford.edu: convertd: CPU time used
avg(total cputime) = 0.07 avg(user time) = 0.07 avg(system time) = 0.01

Host zm10.stanford.edu: convertd: Resident Memory
avg(convertd rss) = 115.63

Host zm10.stanford.edu: convertd: Processes and Threads
avg(processes) = 5.47 avg(threads) = 5.48

No data available for the following charts:
Host zm10.stanford.edu: nginx: CPU time used
Host zm10.stanford.edu: nginx: Resident Memory
Host zm10.stanford.edu: nginx: Processes and Threads