2013-04-19
Additional charts
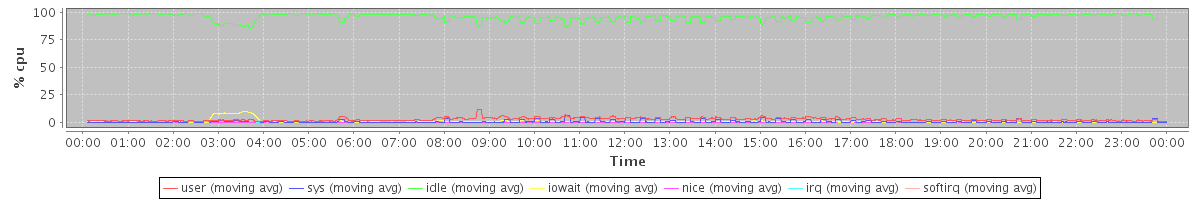
Host zm10.stanford.edu: Total CPU
avg(user) = 2.61 avg(sys) = 0.74 avg(idle) = 95.69 avg(iowait) = 0.80 avg(nice) = 0.10 avg(irq) = 0.00 avg(softirq) = 0.04
Host zm10.stanford.edu: Process CPU
avg(mailbox) = 1.74 avg(mysql) = 0.33 avg(stats) = 0.00

Host zm10.stanford.edu: Process Total Memory
avg(mailbox) = 22937.39 avg(mysql) = 30142.70 avg(stats) = 0.00

Host zm10.stanford.edu: Process Resident Memory
avg(mailbox) = 10595.08 avg(mysql) = 18023.78 avg(stats) = 0.00

Host zm10.stanford.edu: Swap Activity
avg(swap in) = 0.00 avg(swap out) = 0.00

Host zm10.stanford.edu: Virtual Memory
avg(swapped) = 58.81 avg(free) = 3187.32 avg(active) = 33781.21 avg(inactive) = 9930.64 avg(page cache) = 13702.08

Host zm10.stanford.edu: Context Switches
avg(context switches) = 3593.18

Host zm10.stanford.edu: Run/Blocked Process Queue Size, Load Average
avg(processes waiting for run time) = 1.50 avg(processes waiting for io time) = 0.30 avg(load average (1 min)) = 1.32

Host zm10.stanford.edu: Disk Utilization (Top 10 avg)
avg(dm-2) = 2.14 avg(dm-0) = 2.48 avg(dm-3) = 6.86 avg(dm-1) = 6.95

Host zm10.stanford.edu: Disk Throughput: /dev/dm-2
avg(dm-2 read) = 490.27 avg(dm-2 write) = 0.29

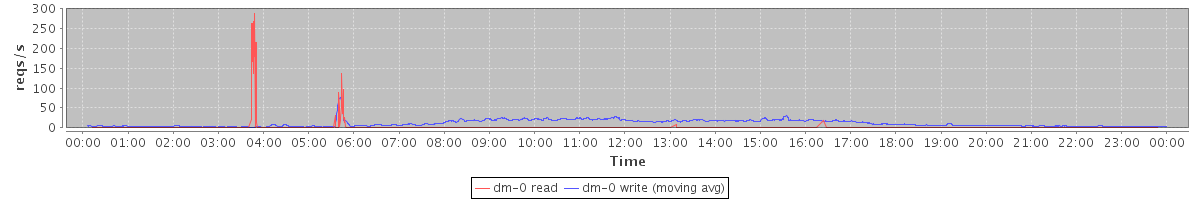
Host zm10.stanford.edu: Disk Throughput: /dev/dm-0
avg(dm-0 read) = 122.35 avg(dm-0 write) = 381.66

Host zm10.stanford.edu: Disk Throughput: /dev/dm-3
avg(dm-3 read) = 432.39 avg(dm-3 write) = 195.64

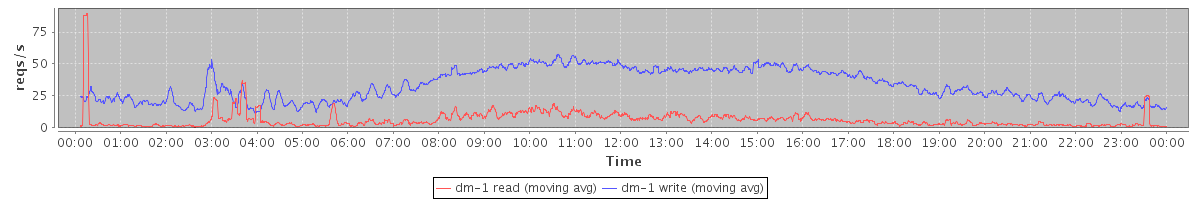
Host zm10.stanford.edu: Disk Throughput: /dev/dm-1
avg(dm-1 read) = 78.52 avg(dm-1 write) = 793.13

Host zm10.stanford.edu: Disk IOPs: /dev/dm-2
avg(dm-2 read) = 11.56 avg(dm-2 write) = 0.02

Host zm10.stanford.edu: Disk IOPs: /dev/dm-0
avg(dm-0 read) = 1.27 avg(dm-0 write) = 10.88
Host zm10.stanford.edu: Disk IOPs: /dev/dm-3
avg(dm-3 read) = 16.30 avg(dm-3 write) = 8.29

Host zm10.stanford.edu: Disk IOPs: /dev/dm-1
avg(dm-1 read) = 6.29 avg(dm-1 write) = 33.21
Host zm10.stanford.edu: Disk Usage
avg(/usr/vice/cache) = 13.01 avg(/opt/zimbra/store) = 32.00 avg(/opt/zimbra) = 20.00 avg(/opt/zimbra/hsm1) = 25.00 avg(/) = 6.00 avg(/opt/zimbra/redolog) = 16.44

Host zm10.stanford.edu: Open file descriptor count
avg(total system file descriptors open) = 6368.31 avg(mailboxd file descriptors open) = 2708.52

Host zm10.stanford.edu: Process CPU Time (Top 10 avg)
avg(tripwire) = 2069.00 avg(updatedb) = 31.00 avg(java) = 1703.98 avg(gzip) = 2123.40 avg(puppetd) = 16.16 avg(mysqld) = 242.33 avg(perl) = 12.03 avg(mysqldump) = 1625.50 avg(zmstat-allprocs) = 15.90 avg(zmcompresslogs) = 1436.50

Host zm10.stanford.edu: SOAP: Invocation Count: Summary (Top 10 max)
max(MsgActionRequest.move) = 986.00 max(MsgActionRequest.delete) = 1427.00 max(NoOpRequest) = 183.00 max(AddMsgRequest) = 155.00 max(GetFolderRequest) = 176.00 max(ContactActionRequest.delete) = 138.00 max(CheckPermissionRequest) = 167.00 max(SyncRequest) = 475.00 max(ContactActionRequest.move) = 683.00 max(CreateContactRequest) = 364.00

Host zm10.stanford.edu: SOAP: Average Call Duration: Summary (Top 10 avg)
avg(CreateSignatureRequest) = 567.00 avg(DeleteAccountRequest) = 21396.00 avg(BackupQueryRequest) = 338.00 avg(GetInfoRequest) = 321.58 avg(CreateAppointmentExceptionRequest) = 1231.00 avg(SendInviteReplyRequest) = 613.79 avg(RemoveAttachmentsRequest) = 580.20 avg(AutoCompleteRequest) = 478.87 avg(SearchGalRequest) = 409.04 avg(GetQuotaUsageRequest) = 1674.00

Host zm10.stanford.edu: MySQL: InnoDB Buffer Pool Pages
avg(pages read) = 1524932.59 avg(pages written) = 27671190.18

Host zm10.stanford.edu: MySQL: InnoDB Buffer Pool Hit Rate
avg(buffer pool hit rate) = 1000.00

Host zm10.stanford.edu: MySQL: Database Connections In Use
avg(connections in use) = 0.19

Host zm10.stanford.edu: MySQL: Tables Open/Opened
avg(open_tables) = 1198.47 avg(opened_tables (cumulative)) = 88283.21

Host zm10.stanford.edu: MySQL: Total Slow Queries Count
avg(slow queries (cumulative)) = 151411.76

Host zm10.stanford.edu: Mailboxd: Connection Pool Get Latency
avg(mysql) = 0.25 avg(ldap) = 147.53

Host zm10.stanford.edu: Mailboxd: Dirty Lucene Index Writers
avg(dirty index writers) = 32.63

Host zm10.stanford.edu: Mailboxd: Lucene IndexWriterCache Hitrate
avg(cache hitrate) = 29.45

Host zm10.stanford.edu: Mailboxd: Lucene IO
avg(Index writes) = 20.22 avg(Index reads) = 47.25

Host zm10.stanford.edu: Mailboxd: LMTP Delivery Throughput
avg(received) = 67.97 avg(delivered) = 79.62

Host zm10.stanford.edu: Mailboxd: LMTP Delivery Rate
avg(received msgs) = 0.45 avg(delivered msgs) = 0.53 avg(received x rcpts) = 0.57

Host zm10.stanford.edu: Mailboxd: Mailbox Add Rate (Delivery Rate)
avg(mailbox add rate) = 0.68

Host zm10.stanford.edu: Mailboxd: Mailbox Add Latency (Delivery Speed)
avg(mailbox add latency) = 38.70

Host zm10.stanford.edu: Mailboxd: Request Rate by Client Protocol
avg(SOAP) = 9.73 avg(IMAP) = 19.39 avg(POP) = 0.96

Host zm10.stanford.edu: Mailboxd: Response Time by Client Protocol
avg(SOAP) = 47.18 avg(IMAP) = 17.05 avg(POP) = 52.51

Host zm10.stanford.edu: Mailboxd: Active Connections by Client Protocol
avg(IMAP) = 82.75 avg(IMAP SSL) = 456.58 avg(POP) = 0.00 avg(POP SSL) = 0.51 avg(SOAP sessions) = 446.25

Host zm10.stanford.edu: Mailboxd: Mailbox Get Count
avg(mailbox get count) = 2283.23

Host zm10.stanford.edu: Mailboxd: Mailbox Get Latency
avg(mailbox get latency) = 0.01

Host zm10.stanford.edu: Mailboxd: Mailbox Cache Hit Rate
avg(mailbox cache hit rate) = 99.99

Host zm10.stanford.edu: Mailboxd: Mailbox Item/Blob Cache Hit Rate
avg(msg blob cache) = 51.22 avg(item metadata cache) = 37.22

Host zm10.stanford.edu: Mailboxd: Minor Garbage Collection Time
avg(minor GC time) = 0.13

Host zm10.stanford.edu: Mailboxd: Major Garbage Collection Time
avg(major GC time) = 0.00

Host zm10.stanford.edu: Mailboxd: Minor Garbage Collection Count
avg(minor GC count) = 1.60

Host zm10.stanford.edu: Mailboxd: Major Garbage Collection Count
avg(major GC count) = 0.01

Host zm10.stanford.edu: Mailboxd: JVM Heap Used
avg(total) = 4180.09 avg(PS Old Gen) = 0.00 avg(CMS Old Gen) = 3264.68 avg(Tenured Gen) = 0.00 avg(Train Gen) = 0.00 avg(PS Eden Space) = 0.00 avg(PS Survivor Space) = 0.00 avg(Par Eden Space) = 796.89 avg(Par Survivor Space) = 118.53 avg(Eden Space) = 0.00 avg(Survivor Space) = 0.00

Host zm10.stanford.edu: Mailboxd: JVM Heap Free
avg(total free) = 3647.22 avg(PS Old Gen free) = 0.00 avg(CMS Old Gen free) = 2756.32 avg(Tenured Gen free) = 0.00 avg(Train Gen free) = 0.00 avg(PS Eden Space free) = 0.00 avg(PS Survivor Space free) = 0.00 avg(Par Eden Space free) = 808.74 avg(Par Survivor Space free) = 82.16 avg(Eden Space free) = 0.00 avg(Survivor Space free) = 0.00

Host zm10.stanford.edu: Mailboxd: JVM Permanent Generation and Code Cache
avg(PS Perm Gen) = 0.00 avg(Perm Gen) = 0.00 avg(CMS Perm Gen) = 143.40 avg(Code Cache) = 47.52 avg(Perm Gen [shared-ro]) = 0.00 avg(Perm Gen [shared-rw]) = 0.00 avg(PS Perm Gen free) = 0.00 avg(Perm Gen free) = 0.00 avg(CMS Perm Gen free) = 98.45 avg(Code Cache free) = 0.35 avg(Perm Gen [shared-ro] free) = 0.00 avg(Perm Gen [shared-rw] free) = 0.00

Host zm10.stanford.edu: convertd: CPU time used
avg(total cputime) = 0.08 avg(user time) = 0.07 avg(system time) = 0.00

Host zm10.stanford.edu: convertd: Resident Memory
avg(convertd rss) = 135.31

Host zm10.stanford.edu: convertd: Processes and Threads
avg(processes) = 5.75 avg(threads) = 5.75

No data available for the following charts:
Host zm10.stanford.edu: nginx: CPU time used
Host zm10.stanford.edu: nginx: Resident Memory
Host zm10.stanford.edu: nginx: Processes and Threads