2013-04-27
Additional charts
Host zm10.stanford.edu: Total CPU
avg(user) = 1.62 avg(sys) = 0.45 avg(idle) = 97.02 avg(iowait) = 0.77 avg(nice) = 0.10 avg(irq) = 0.00 avg(softirq) = 0.01

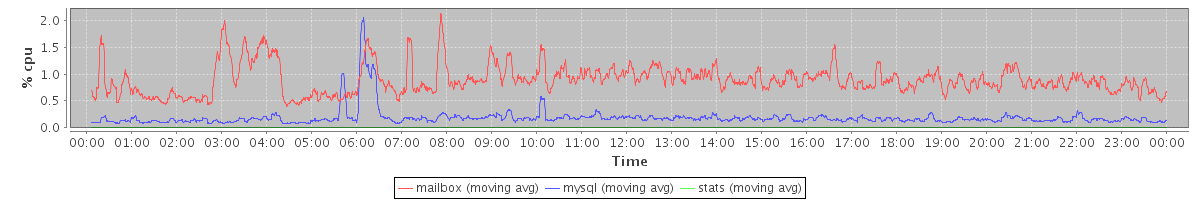
Host zm10.stanford.edu: Process CPU
avg(mailbox) = 0.89 avg(mysql) = 0.19 avg(stats) = 0.00
Host zm10.stanford.edu: Process Total Memory
avg(mailbox) = 22689.09 avg(mysql) = 30142.70 avg(stats) = 0.00

Host zm10.stanford.edu: Process Resident Memory
avg(mailbox) = 10418.47 avg(mysql) = 18050.98 avg(stats) = 0.00

Host zm10.stanford.edu: Swap Activity
avg(swap in) = 0.00 avg(swap out) = 0.01

Host zm10.stanford.edu: Virtual Memory
avg(swapped) = 63.88 avg(free) = 3624.80 avg(active) = 33164.27 avg(inactive) = 10232.72 avg(page cache) = 13550.65

Host zm10.stanford.edu: Context Switches
avg(context switches) = 2525.86

Host zm10.stanford.edu: Run/Blocked Process Queue Size, Load Average
avg(processes waiting for run time) = 1.17 avg(processes waiting for io time) = 0.28 avg(load average (1 min)) = 1.00

Host zm10.stanford.edu: Disk Utilization (Top 10 avg)
avg(dm-2) = 3.09 avg(dm-0) = 0.98 avg(dm-3) = 5.64 avg(dm-1) = 3.60

Host zm10.stanford.edu: Disk Throughput: /dev/dm-2
avg(dm-2 read) = 652.14 avg(dm-2 write) = 73.66

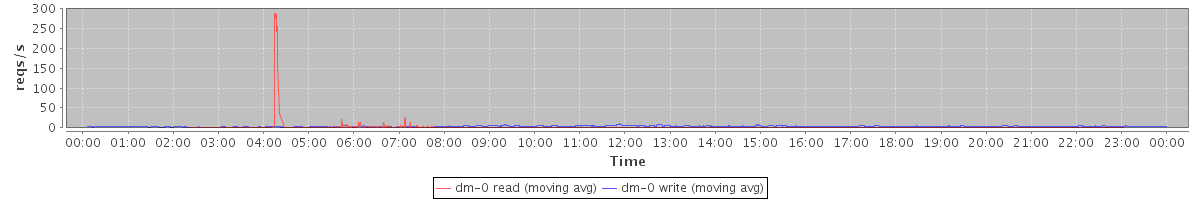
Host zm10.stanford.edu: Disk Throughput: /dev/dm-0
avg(dm-0 read) = 110.63 avg(dm-0 write) = 58.12

Host zm10.stanford.edu: Disk Throughput: /dev/dm-3
avg(dm-3 read) = 473.33 avg(dm-3 write) = 77.54

Host zm10.stanford.edu: Disk Throughput: /dev/dm-1
avg(dm-1 read) = 45.33 avg(dm-1 write) = 378.75

Host zm10.stanford.edu: Disk IOPs: /dev/dm-2
avg(dm-2 read) = 12.50 avg(dm-2 write) = 0.38

Host zm10.stanford.edu: Disk IOPs: /dev/dm-0
avg(dm-0 read) = 1.09 avg(dm-0 write) = 3.47
Host zm10.stanford.edu: Disk IOPs: /dev/dm-3
avg(dm-3 read) = 18.14 avg(dm-3 write) = 4.32

Host zm10.stanford.edu: Disk IOPs: /dev/dm-1
avg(dm-1 read) = 3.13 avg(dm-1 write) = 18.05

Host zm10.stanford.edu: Disk Usage
avg(/usr/vice/cache) = 13.01 avg(/opt/zimbra/store) = 33.00 avg(/opt/zimbra) = 20.00 avg(/opt/zimbra/hsm1) = 25.00 avg(/) = 6.01 avg(/opt/zimbra/redolog) = 14.84

Host zm10.stanford.edu: Open file descriptor count
avg(total system file descriptors open) = 5934.83 avg(mailboxd file descriptors open) = 2347.73

Host zm10.stanford.edu: Process CPU Time (Top 10 avg)
avg(tripwire) = 1996.00 avg(updatedb) = 26.92 avg(java) = 891.76 avg(gzip) = 1987.36 avg(puppetd) = 16.03 avg(mysqld) = 149.61 avg(mysqldump) = 1339.40 avg(zm-admin) = 9.00 avg(zmstat-allprocs) = 15.76 avg(zmcompresslogs) = 1069.67

Host zm10.stanford.edu: SOAP: Invocation Count: Summary (Top 10 max)
max(MsgActionRequest.move) = 127.00 max(SearchRequest) = 98.00 max(MsgActionRequest.delete) = 470.00 max(NoOpRequest) = 110.00 max(GetDomainInfoRequest) = 40.00 max(SearchConvRequest) = 52.00 max(GetFolderRequest) = 62.00 max(ItemActionRequest.delete) = 31.00 max(SyncRequest) = 98.00 max(GetEffectiveFolderPermsRequest) = 36.00

Host zm10.stanford.edu: SOAP: Average Call Duration: Summary (Top 10 avg)
avg(GetShareInfoRequest) = 471.67 avg(DeleteAccountRequest) = 40098.67 avg(CreateMountpointRequest) = 826.50 avg(BackupQueryRequest) = 312.00 avg(GetInfoRequest) = 402.94 avg(CancelAppointmentRequest) = 356.75 avg(AutoCompleteRequest) = 513.61 avg(SearchGalRequest) = 372.17 avg(FolderActionRequest.empty) = 660.43 avg(GetQuotaUsageRequest) = 3112.00

Host zm10.stanford.edu: MySQL: InnoDB Buffer Pool Pages
avg(pages read) = 2202136.62 avg(pages written) = 38229244.28

Host zm10.stanford.edu: MySQL: InnoDB Buffer Pool Hit Rate
avg(buffer pool hit rate) = 1000.00

Host zm10.stanford.edu: MySQL: Database Connections In Use
avg(connections in use) = 0.12

Host zm10.stanford.edu: MySQL: Tables Open/Opened
avg(open_tables) = 1198.05 avg(opened_tables (cumulative)) = 122754.72

Host zm10.stanford.edu: MySQL: Total Slow Queries Count
avg(slow queries (cumulative)) = 224470.43

Host zm10.stanford.edu: Mailboxd: Connection Pool Get Latency
avg(mysql) = 0.25 avg(ldap) = 142.99

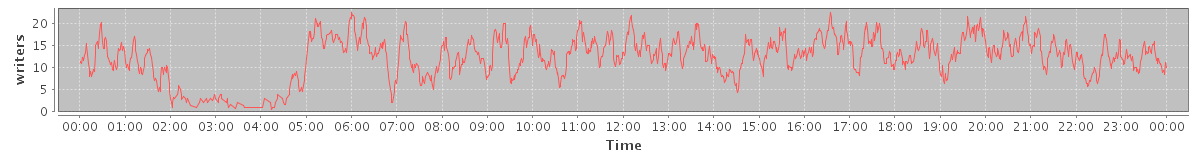
Host zm10.stanford.edu: Mailboxd: Dirty Lucene Index Writers
avg(dirty index writers) = 11.71
Host zm10.stanford.edu: Mailboxd: Lucene IndexWriterCache Hitrate
avg(cache hitrate) = 19.53

Host zm10.stanford.edu: Mailboxd: Lucene IO
avg(Index writes) = 5.62 avg(Index reads) = 12.37

Host zm10.stanford.edu: Mailboxd: LMTP Delivery Throughput
avg(received) = 26.30 avg(delivered) = 16.27

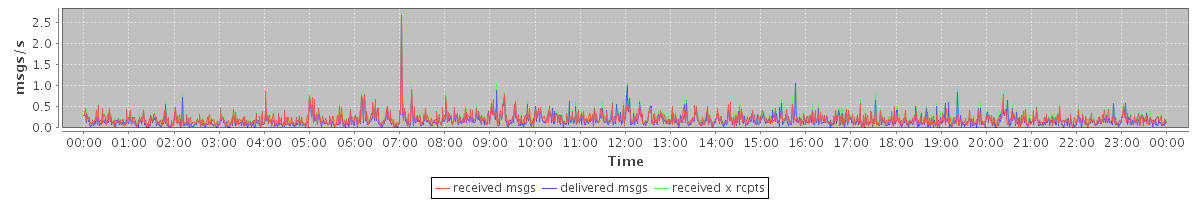
Host zm10.stanford.edu: Mailboxd: LMTP Delivery Rate
avg(received msgs) = 0.21 avg(delivered msgs) = 0.17 avg(received x rcpts) = 0.24
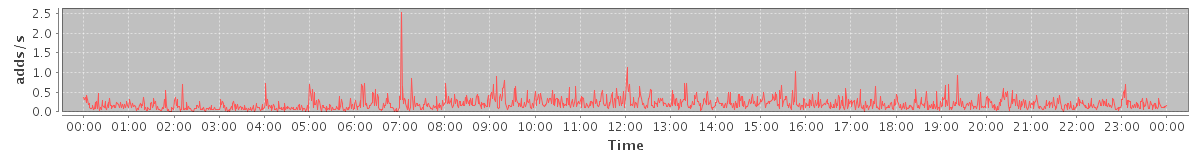
Host zm10.stanford.edu: Mailboxd: Mailbox Add Rate (Delivery Rate)
avg(mailbox add rate) = 0.20
Host zm10.stanford.edu: Mailboxd: Mailbox Add Latency (Delivery Speed)
avg(mailbox add latency) = 38.50

Host zm10.stanford.edu: Mailboxd: Request Rate by Client Protocol
avg(SOAP) = 3.46 avg(IMAP) = 13.82 avg(POP) = 0.65

Host zm10.stanford.edu: Mailboxd: Response Time by Client Protocol
avg(SOAP) = 53.30 avg(IMAP) = 16.62 avg(POP) = 58.63

Host zm10.stanford.edu: Mailboxd: Active Connections by Client Protocol
avg(IMAP) = 69.42 avg(IMAP SSL) = 380.22 avg(POP) = 0.00 avg(POP SSL) = 0.38 avg(SOAP sessions) = 128.16

Host zm10.stanford.edu: Mailboxd: Mailbox Get Count
avg(mailbox get count) = 1097.40

Host zm10.stanford.edu: Mailboxd: Mailbox Get Latency
avg(mailbox get latency) = 0.06

Host zm10.stanford.edu: Mailboxd: Mailbox Cache Hit Rate
avg(mailbox cache hit rate) = 99.87

Host zm10.stanford.edu: Mailboxd: Mailbox Item/Blob Cache Hit Rate
avg(msg blob cache) = 57.59 avg(item metadata cache) = 35.44

Host zm10.stanford.edu: Mailboxd: Minor Garbage Collection Time
avg(minor GC time) = 0.07

Host zm10.stanford.edu: Mailboxd: Major Garbage Collection Time
avg(major GC time) = 0.00

Host zm10.stanford.edu: Mailboxd: Minor Garbage Collection Count
avg(minor GC count) = 0.81

Host zm10.stanford.edu: Mailboxd: Major Garbage Collection Count
avg(major GC count) = 0.00

Host zm10.stanford.edu: Mailboxd: JVM Heap Used
avg(total) = 4245.89 avg(PS Old Gen) = 0.00 avg(CMS Old Gen) = 3325.67 avg(Tenured Gen) = 0.00 avg(Train Gen) = 0.00 avg(PS Eden Space) = 0.00 avg(PS Survivor Space) = 0.00 avg(Par Eden Space) = 803.97 avg(Par Survivor Space) = 116.25 avg(Eden Space) = 0.00 avg(Survivor Space) = 0.00

Host zm10.stanford.edu: Mailboxd: JVM Heap Free
avg(total free) = 3581.42 avg(PS Old Gen free) = 0.00 avg(CMS Old Gen free) = 2695.33 avg(Tenured Gen free) = 0.00 avg(Train Gen free) = 0.00 avg(PS Eden Space free) = 0.00 avg(PS Survivor Space free) = 0.00 avg(Par Eden Space free) = 801.65 avg(Par Survivor Space free) = 84.44 avg(Eden Space free) = 0.00 avg(Survivor Space free) = 0.00

Host zm10.stanford.edu: Mailboxd: JVM Permanent Generation and Code Cache
avg(PS Perm Gen) = 0.00 avg(Perm Gen) = 0.00 avg(CMS Perm Gen) = 145.02 avg(Code Cache) = 47.52 avg(Perm Gen [shared-ro]) = 0.00 avg(Perm Gen [shared-rw]) = 0.00 avg(PS Perm Gen free) = 0.00 avg(Perm Gen free) = 0.00 avg(CMS Perm Gen free) = 98.88 avg(Code Cache free) = 0.35 avg(Perm Gen [shared-ro] free) = 0.00 avg(Perm Gen [shared-rw] free) = 0.00

Host zm10.stanford.edu: convertd: CPU time used
avg(total cputime) = 0.02 avg(user time) = 0.02 avg(system time) = 0.00

Host zm10.stanford.edu: convertd: Resident Memory
avg(convertd rss) = 126.07

Host zm10.stanford.edu: convertd: Processes and Threads
avg(processes) = 5.92 avg(threads) = 5.94

No data available for the following charts:
Host zm10.stanford.edu: nginx: CPU time used
Host zm10.stanford.edu: nginx: Resident Memory
Host zm10.stanford.edu: nginx: Processes and Threads