2013-05-08
Additional charts
Host zm10.stanford.edu: Total CPU
avg(user) = 2.26 avg(sys) = 0.85 avg(idle) = 95.84 avg(iowait) = 0.88 avg(nice) = 0.10 avg(irq) = 0.00 avg(softirq) = 0.05

Host zm10.stanford.edu: Process CPU
avg(mailbox) = 1.36 avg(mysql) = 0.37 avg(stats) = 0.00

Host zm10.stanford.edu: Process Total Memory
avg(mailbox) = 22375.42 avg(mysql) = 30142.70 avg(stats) = 0.00

Host zm10.stanford.edu: Process Resident Memory
avg(mailbox) = 10114.12 avg(mysql) = 18064.63 avg(stats) = 0.00

Host zm10.stanford.edu: Swap Activity
avg(swap in) = 0.02 avg(swap out) = 0.01

Host zm10.stanford.edu: Virtual Memory
avg(swapped) = 71.80 avg(free) = 3126.14 avg(active) = 33521.84 avg(inactive) = 10219.73 avg(page cache) = 14079.99

Host zm10.stanford.edu: Context Switches
avg(context switches) = 3981.50

Host zm10.stanford.edu: Run/Blocked Process Queue Size, Load Average
avg(processes waiting for run time) = 1.51 avg(processes waiting for io time) = 0.34 avg(load average (1 min)) = 1.32

Host zm10.stanford.edu: Disk Utilization (Top 10 avg)
avg(dm-2) = 1.94 avg(dm-0) = 3.34 avg(dm-3) = 8.05 avg(dm-1) = 8.32

Host zm10.stanford.edu: Disk Throughput: /dev/dm-2
avg(dm-2 read) = 282.94 avg(dm-2 write) = 0.60

Host zm10.stanford.edu: Disk Throughput: /dev/dm-0
avg(dm-0 read) = 123.24 avg(dm-0 write) = 442.39

Host zm10.stanford.edu: Disk Throughput: /dev/dm-3
avg(dm-3 read) = 459.33 avg(dm-3 write) = 225.09

Host zm10.stanford.edu: Disk Throughput: /dev/dm-1
avg(dm-1 read) = 88.08 avg(dm-1 write) = 921.46

Host zm10.stanford.edu: Disk IOPs: /dev/dm-2
avg(dm-2 read) = 5.90 avg(dm-2 write) = 0.03

Host zm10.stanford.edu: Disk IOPs: /dev/dm-0
avg(dm-0 read) = 1.21 avg(dm-0 write) = 13.30

Host zm10.stanford.edu: Disk IOPs: /dev/dm-3
avg(dm-3 read) = 16.99 avg(dm-3 write) = 9.96

Host zm10.stanford.edu: Disk IOPs: /dev/dm-1
avg(dm-1 read) = 7.06 avg(dm-1 write) = 37.48

Host zm10.stanford.edu: Disk Usage
avg(/usr/vice/cache) = 13.00 avg(/opt/zimbra/store) = 35.00 avg(/opt/zimbra) = 20.00 avg(/opt/zimbra/hsm1) = 24.00 avg(/) = 6.00 avg(/opt/zimbra/redolog) = 14.27

Host zm10.stanford.edu: Open file descriptor count
avg(total system file descriptors open) = 6408.27 avg(mailboxd file descriptors open) = 2845.68

Host zm10.stanford.edu: Process CPU Time (Top 10 avg)
avg(tripwire) = 1079.50 avg(updatedb) = 31.03 avg(java) = 1494.92 avg(gzip) = 2116.57 avg(puppetd) = 16.83 avg(mysqld) = 268.86 avg(yum) = 95.50 avg(mysqldump) = 1723.50 avg(zmstat-allprocs) = 16.04 avg(zmcompresslogs) = 1377.00

Host zm10.stanford.edu: SOAP: Invocation Count: Summary (Top 10 max)
max(MsgActionRequest.move) = 2545.00 max(SearchRequest) = 101.00 max(GetContactsRequest) = 355.00 max(MsgActionRequest.delete) = 341.00 max(NoOpRequest) = 215.00 max(AddMsgRequest) = 209.00 max(GetFolderRequest) = 191.00 max(SyncRequest) = 549.00 max(GetEffectiveFolderPermsRequest) = 142.00 max(GetAppointmentRequest) = 1189.00

Host zm10.stanford.edu: SOAP: Average Call Duration: Summary (Top 10 avg)
avg(ModifyAppointmentRequest) = 481.84 avg(DeleteAccountRequest) = 24211.25 avg(CreateMountpointRequest) = 376.60 avg(GetInfoRequest) = 363.80 avg(SendInviteReplyRequest) = 507.32 avg(AutoCompleteRequest) = 364.60 avg(ApplyFilterRulesRequest) = 2579.00 avg(SearchGalRequest) = 326.30 avg(FolderActionRequest.empty) = 324.45 avg(GetQuotaUsageRequest) = 1469.00

Host zm10.stanford.edu: MySQL: InnoDB Buffer Pool Pages
avg(pages read) = 2912078.81 avg(pages written) = 52977991.94

Host zm10.stanford.edu: MySQL: InnoDB Buffer Pool Hit Rate
avg(buffer pool hit rate) = 1000.00

Host zm10.stanford.edu: MySQL: Database Connections In Use
avg(connections in use) = 0.19

Host zm10.stanford.edu: MySQL: Tables Open/Opened
avg(open_tables) = 1198.31 avg(opened_tables (cumulative)) = 171017.52

Host zm10.stanford.edu: MySQL: Total Slow Queries Count
avg(slow queries (cumulative)) = 298787.33

Host zm10.stanford.edu: Mailboxd: Connection Pool Get Latency
avg(mysql) = 0.24 avg(ldap) = 157.38

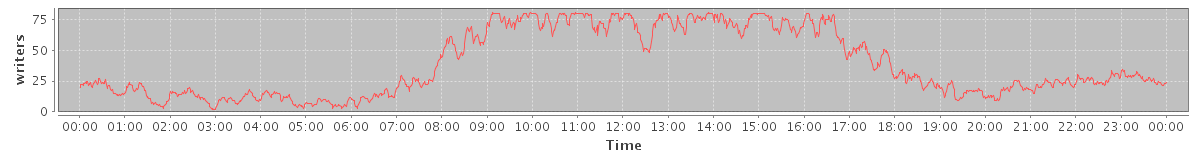
Host zm10.stanford.edu: Mailboxd: Dirty Lucene Index Writers
avg(dirty index writers) = 38.58
Host zm10.stanford.edu: Mailboxd: Lucene IndexWriterCache Hitrate
avg(cache hitrate) = 30.88

Host zm10.stanford.edu: Mailboxd: Lucene IO
avg(Index writes) = 31.99 avg(Index reads) = 67.99

Host zm10.stanford.edu: Mailboxd: LMTP Delivery Throughput
avg(received) = 73.19 avg(delivered) = 99.71

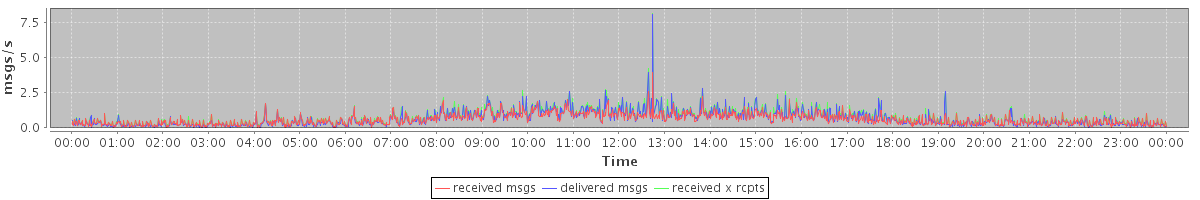
Host zm10.stanford.edu: Mailboxd: LMTP Delivery Rate
avg(received msgs) = 0.60 avg(delivered msgs) = 0.63 avg(received x rcpts) = 0.73
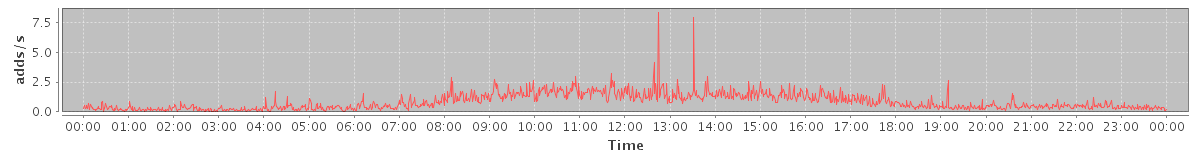
Host zm10.stanford.edu: Mailboxd: Mailbox Add Rate (Delivery Rate)
avg(mailbox add rate) = 0.83
Host zm10.stanford.edu: Mailboxd: Mailbox Add Latency (Delivery Speed)
avg(mailbox add latency) = 41.52

Host zm10.stanford.edu: Mailboxd: Request Rate by Client Protocol
avg(SOAP) = 11.85 avg(IMAP) = 27.59 avg(POP) = 1.20

Host zm10.stanford.edu: Mailboxd: Response Time by Client Protocol
avg(SOAP) = 51.90 avg(IMAP) = 21.02 avg(POP) = 147.47

Host zm10.stanford.edu: Mailboxd: Active Connections by Client Protocol
avg(IMAP) = 98.49 avg(IMAP SSL) = 533.67 avg(POP) = 0.01 avg(POP SSL) = 0.73 avg(SOAP sessions) = 530.06

Host zm10.stanford.edu: Mailboxd: Mailbox Get Count
avg(mailbox get count) = 3056.93

Host zm10.stanford.edu: Mailboxd: Mailbox Get Latency
avg(mailbox get latency) = 0.02

Host zm10.stanford.edu: Mailboxd: Mailbox Cache Hit Rate
avg(mailbox cache hit rate) = 99.99

Host zm10.stanford.edu: Mailboxd: Mailbox Item/Blob Cache Hit Rate
avg(msg blob cache) = 44.38 avg(item metadata cache) = 35.23

Host zm10.stanford.edu: Mailboxd: Minor Garbage Collection Time
avg(minor GC time) = 0.17

Host zm10.stanford.edu: Mailboxd: Major Garbage Collection Time
avg(major GC time) = 0.00

Host zm10.stanford.edu: Mailboxd: Minor Garbage Collection Count
avg(minor GC count) = 2.00

Host zm10.stanford.edu: Mailboxd: Major Garbage Collection Count
avg(major GC count) = 0.01

Host zm10.stanford.edu: Mailboxd: JVM Heap Used
avg(total) = 4206.84 avg(PS Old Gen) = 0.00 avg(CMS Old Gen) = 3290.26 avg(Tenured Gen) = 0.00 avg(Train Gen) = 0.00 avg(PS Eden Space) = 0.00 avg(PS Survivor Space) = 0.00 avg(Par Eden Space) = 797.68 avg(Par Survivor Space) = 118.90 avg(Eden Space) = 0.00 avg(Survivor Space) = 0.00

Host zm10.stanford.edu: Mailboxd: JVM Heap Free
avg(total free) = 3620.47 avg(PS Old Gen free) = 0.00 avg(CMS Old Gen free) = 2730.74 avg(Tenured Gen free) = 0.00 avg(Train Gen free) = 0.00 avg(PS Eden Space free) = 0.00 avg(PS Survivor Space free) = 0.00 avg(Par Eden Space free) = 807.94 avg(Par Survivor Space free) = 81.79 avg(Eden Space free) = 0.00 avg(Survivor Space free) = 0.00

Host zm10.stanford.edu: Mailboxd: JVM Permanent Generation and Code Cache
avg(PS Perm Gen) = 0.00 avg(Perm Gen) = 0.00 avg(CMS Perm Gen) = 125.59 avg(Code Cache) = 46.62 avg(Perm Gen [shared-ro]) = 0.00 avg(Perm Gen [shared-rw]) = 0.00 avg(PS Perm Gen free) = 0.00 avg(Perm Gen free) = 0.00 avg(CMS Perm Gen free) = 84.68 avg(Code Cache free) = 0.38 avg(Perm Gen [shared-ro] free) = 0.00 avg(Perm Gen [shared-rw] free) = 0.00

Host zm10.stanford.edu: convertd: CPU time used
avg(total cputime) = 0.10 avg(user time) = 0.09 avg(system time) = 0.01

Host zm10.stanford.edu: convertd: Resident Memory
avg(convertd rss) = 157.60

Host zm10.stanford.edu: convertd: Processes and Threads
avg(processes) = 5.89 avg(threads) = 5.89

No data available for the following charts:
Host zm10.stanford.edu: nginx: CPU time used
Host zm10.stanford.edu: nginx: Resident Memory
Host zm10.stanford.edu: nginx: Processes and Threads