2013-05-12
Additional charts
Host zm10.stanford.edu: Total CPU
avg(user) = 1.41 avg(sys) = 0.40 avg(idle) = 97.43 avg(iowait) = 0.61 avg(nice) = 0.10 avg(irq) = 0.00 avg(softirq) = 0.01

Host zm10.stanford.edu: Process CPU
avg(mailbox) = 0.71 avg(mysql) = 0.18 avg(stats) = 0.00

Host zm10.stanford.edu: Process Total Memory
avg(mailbox) = 22395.48 avg(mysql) = 30142.70 avg(stats) = 0.00

Host zm10.stanford.edu: Process Resident Memory
avg(mailbox) = 10084.09 avg(mysql) = 18080.03 avg(stats) = 0.00

Host zm10.stanford.edu: Swap Activity
avg(swap in) = 0.00 avg(swap out) = 0.03

Host zm10.stanford.edu: Virtual Memory
avg(swapped) = 77.04 avg(free) = 4048.14 avg(active) = 33032.87 avg(inactive) = 9944.65 avg(page cache) = 13538.43

Host zm10.stanford.edu: Context Switches
avg(context switches) = 2604.01

Host zm10.stanford.edu: Run/Blocked Process Queue Size, Load Average
avg(processes waiting for run time) = 1.29 avg(processes waiting for io time) = 0.23 avg(load average (1 min)) = 0.88

Host zm10.stanford.edu: Disk Utilization (Top 10 avg)
avg(dm-2) = 1.80 avg(dm-0) = 1.02 avg(dm-3) = 4.45 avg(dm-1) = 3.97

Host zm10.stanford.edu: Disk Throughput: /dev/dm-2
avg(dm-2 read) = 439.01 avg(dm-2 write) = 0.12

Host zm10.stanford.edu: Disk Throughput: /dev/dm-0
avg(dm-0 read) = 55.83 avg(dm-0 write) = 220.60

Host zm10.stanford.edu: Disk Throughput: /dev/dm-3
avg(dm-3 read) = 436.69 avg(dm-3 write) = 78.20

Host zm10.stanford.edu: Disk Throughput: /dev/dm-1
avg(dm-1 read) = 47.40 avg(dm-1 write) = 459.70

Host zm10.stanford.edu: Disk IOPs: /dev/dm-2
avg(dm-2 read) = 7.55 avg(dm-2 write) = 0.00

Host zm10.stanford.edu: Disk IOPs: /dev/dm-0
avg(dm-0 read) = 1.23 avg(dm-0 write) = 4.20

Host zm10.stanford.edu: Disk IOPs: /dev/dm-3
avg(dm-3 read) = 15.70 avg(dm-3 write) = 4.04

Host zm10.stanford.edu: Disk IOPs: /dev/dm-1
avg(dm-1 read) = 3.53 avg(dm-1 write) = 20.90

Host zm10.stanford.edu: Disk Usage
avg(/usr/vice/cache) = 13.00 avg(/opt/zimbra/store) = 35.00 avg(/opt/zimbra) = 20.00 avg(/opt/zimbra/hsm1) = 24.00 avg(/) = 6.00 avg(/opt/zimbra/redolog) = 12.80

Host zm10.stanford.edu: Open file descriptor count
avg(total system file descriptors open) = 5949.70 avg(mailboxd file descriptors open) = 2368.97

Host zm10.stanford.edu: Process CPU Time (Top 10 avg)
avg(tripwire) = 2014.00 avg(updatedb) = 30.69 avg(java) = 743.29 avg(gzip) = 2066.10 avg(puppetd) = 16.14 avg(mysqld) = 146.76 avg(mysqldump) = 1422.78 avg(zm-admin) = 8.60 avg(zmstat-allprocs) = 15.74 avg(zmcompresslogs) = 770.00

Host zm10.stanford.edu: SOAP: Invocation Count: Summary (Top 10 max)
max(MsgActionRequest.move) = 46.00 max(SearchConvRequest) = 41.00 max(AutoCompleteRequest) = 42.00 max(SearchRequest) = 62.00 max(GetFolderRequest) = 79.00 max(MsgActionRequest.delete) = 122.00 max(NoOpRequest) = 63.00 max(SyncRequest) = 118.00 max(GetEffectiveFolderPermsRequest) = 60.00 max(GetDomainInfoRequest) = 327.00

Host zm10.stanford.edu: SOAP: Average Call Duration: Summary (Top 10 avg)
avg(SendInviteReplyRequest) = 642.50 avg(AutoCompleteRequest) = 359.13 avg(SendMsgRequest) = 287.25 avg(ModifyPropertiesRequest) = 313.00 avg(DeleteAccountRequest) = 43761.00 avg(SearchGalRequest) = 339.05 avg(GetInfoRequest) = 405.94 avg(GetFreeBusyRequest) = 966.72 avg(FolderActionRequest.empty) = 321.50 avg(GetQuotaUsageRequest) = 1065.00

Host zm10.stanford.edu: MySQL: InnoDB Buffer Pool Pages
avg(pages read) = 2992509.33 avg(pages written) = 58035746.94

Host zm10.stanford.edu: MySQL: InnoDB Buffer Pool Hit Rate
avg(buffer pool hit rate) = 1000.00

Host zm10.stanford.edu: MySQL: Database Connections In Use
avg(connections in use) = 0.08

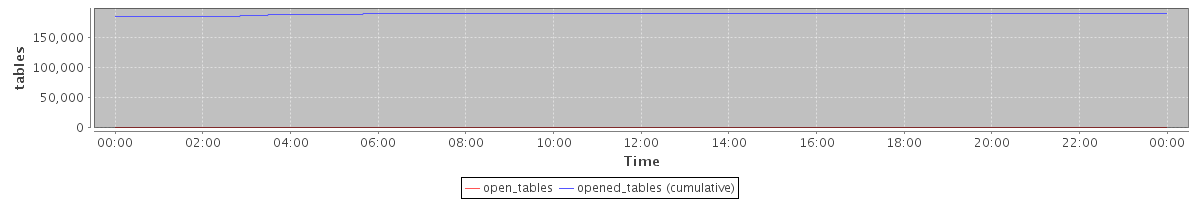
Host zm10.stanford.edu: MySQL: Tables Open/Opened
avg(open_tables) = 1197.99 avg(opened_tables (cumulative)) = 188513.76
Host zm10.stanford.edu: MySQL: Total Slow Queries Count
avg(slow queries (cumulative)) = 338492.53

Host zm10.stanford.edu: Mailboxd: Connection Pool Get Latency
avg(mysql) = 0.25 avg(ldap) = 151.46

Host zm10.stanford.edu: Mailboxd: Dirty Lucene Index Writers
avg(dirty index writers) = 11.95

Host zm10.stanford.edu: Mailboxd: Lucene IndexWriterCache Hitrate
avg(cache hitrate) = 21.74

Host zm10.stanford.edu: Mailboxd: Lucene IO
avg(Index writes) = 7.51 avg(Index reads) = 16.36

Host zm10.stanford.edu: Mailboxd: LMTP Delivery Throughput
avg(received) = 32.89 avg(delivered) = 25.15

Host zm10.stanford.edu: Mailboxd: LMTP Delivery Rate
avg(received msgs) = 0.24 avg(delivered msgs) = 0.20 avg(received x rcpts) = 0.28

Host zm10.stanford.edu: Mailboxd: Mailbox Add Rate (Delivery Rate)
avg(mailbox add rate) = 0.23

Host zm10.stanford.edu: Mailboxd: Mailbox Add Latency (Delivery Speed)
avg(mailbox add latency) = 44.34

Host zm10.stanford.edu: Mailboxd: Request Rate by Client Protocol
avg(SOAP) = 3.71 avg(IMAP) = 13.58 avg(POP) = 0.97

Host zm10.stanford.edu: Mailboxd: Response Time by Client Protocol
avg(SOAP) = 51.84 avg(IMAP) = 17.17 avg(POP) = 69.42

Host zm10.stanford.edu: Mailboxd: Active Connections by Client Protocol
avg(IMAP) = 75.23 avg(IMAP SSL) = 408.32 avg(POP) = 0.00 avg(POP SSL) = 0.52 avg(SOAP sessions) = 123.79

Host zm10.stanford.edu: Mailboxd: Mailbox Get Count
avg(mailbox get count) = 1107.36

Host zm10.stanford.edu: Mailboxd: Mailbox Get Latency
avg(mailbox get latency) = 0.02

Host zm10.stanford.edu: Mailboxd: Mailbox Cache Hit Rate
avg(mailbox cache hit rate) = 99.97

Host zm10.stanford.edu: Mailboxd: Mailbox Item/Blob Cache Hit Rate
avg(msg blob cache) = 52.91 avg(item metadata cache) = 35.41

Host zm10.stanford.edu: Mailboxd: Minor Garbage Collection Time
avg(minor GC time) = 0.07

Host zm10.stanford.edu: Mailboxd: Major Garbage Collection Time
avg(major GC time) = 0.00

Host zm10.stanford.edu: Mailboxd: Minor Garbage Collection Count
avg(minor GC count) = 0.83

Host zm10.stanford.edu: Mailboxd: Major Garbage Collection Count
avg(major GC count) = 0.00

Host zm10.stanford.edu: Mailboxd: JVM Heap Used
avg(total) = 4132.02 avg(PS Old Gen) = 0.00 avg(CMS Old Gen) = 3213.19 avg(Tenured Gen) = 0.00 avg(Train Gen) = 0.00 avg(PS Eden Space) = 0.00 avg(PS Survivor Space) = 0.00 avg(Par Eden Space) = 804.73 avg(Par Survivor Space) = 114.10 avg(Eden Space) = 0.00 avg(Survivor Space) = 0.00

Host zm10.stanford.edu: Mailboxd: JVM Heap Free
avg(total free) = 3695.29 avg(PS Old Gen free) = 0.00 avg(CMS Old Gen free) = 2807.81 avg(Tenured Gen free) = 0.00 avg(Train Gen free) = 0.00 avg(PS Eden Space free) = 0.00 avg(PS Survivor Space free) = 0.00 avg(Par Eden Space free) = 800.90 avg(Par Survivor Space free) = 86.58 avg(Eden Space free) = 0.00 avg(Survivor Space free) = 0.00

Host zm10.stanford.edu: Mailboxd: JVM Permanent Generation and Code Cache
avg(PS Perm Gen) = 0.00 avg(Perm Gen) = 0.00 avg(CMS Perm Gen) = 130.99 avg(Code Cache) = 47.40 avg(Perm Gen [shared-ro]) = 0.00 avg(Perm Gen [shared-rw]) = 0.00 avg(PS Perm Gen free) = 0.00 avg(Perm Gen free) = 0.00 avg(CMS Perm Gen free) = 89.31 avg(Code Cache free) = 0.44 avg(Perm Gen [shared-ro] free) = 0.00 avg(Perm Gen [shared-rw] free) = 0.00

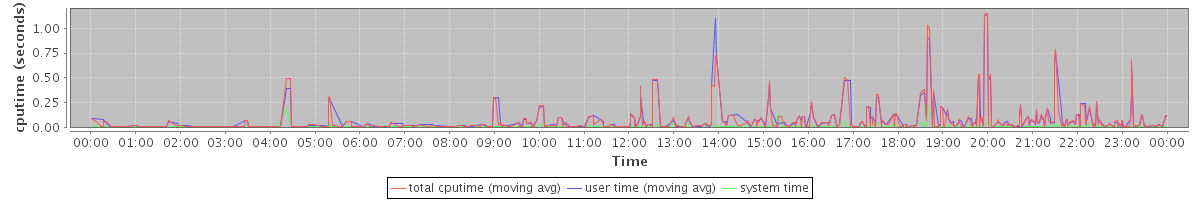
Host zm10.stanford.edu: convertd: CPU time used
avg(total cputime) = 0.01 avg(user time) = 0.01 avg(system time) = 0.00
Host zm10.stanford.edu: convertd: Resident Memory
avg(convertd rss) = 84.24

Host zm10.stanford.edu: convertd: Processes and Threads
avg(processes) = 5.54 avg(threads) = 5.54

No data available for the following charts:
Host zm10.stanford.edu: nginx: CPU time used
Host zm10.stanford.edu: nginx: Resident Memory
Host zm10.stanford.edu: nginx: Processes and Threads