The Spatial and Temporal Distributions of U.S. Winds and Windpower at 80 m Derived from Measurements

by Cristina L. Archer and Mark Z. Jacobson

The paper corresponding to this web site can be found by clicking here (Archer, C.L., and M.Z. Jacobson, Journal of Geophysical Research, Vol. 108, No. D9, 4289, doi:10.1029/2002JD002076, May 16, 2003).

Since publication of the paper, results have been updated. This web page provides a list of changes/improvements and a new version of figures and tables (as of April 2004). A paper with details of the updates can be downloaded here (Archer, C. L., and M. Z. Jacobson, Journal of Geophysical Research, Vol. 109, D20116, dor:10.1029/2004JD005099, 29 October 2004). For more recent findings, see our global wind power page.

Changes in Least-Square (LS) methodology for vertical profiles:
(1) a fifth fitting curve was introduced (the other curves were: LS power law, LS log law, two-parameter log law, and linear), namely a Forced Power Law. This curve forces a power-law profile to pass through three altitudes: 0 m, 10 m, and the lowest height above 80 m (z3) for cases where z3 is above 80 m and the estimated value of wind speed at 80 m (V80) with other methods is greater than the observed value at z3.
(2) the lowest value in the sounding profile (V10) is taken only if it was retrieved at an elevation between 10 and 18 m above ground.
(3) V10 is only accepted if < 50 knots.
(4) Wind speed values above 10 m are only accepted if < 100 knots.
(5) V80 is only accepted if <= 3 x V10.

Changes in the hourly pattern methodology:
(1) The correct formula for the estimate of rhobar is
rhobar = 0.95 x (rho00 + rho12)/2
where 0.95 was instead at the denominator in the paper (paragraph 26). This error caused an overestimate of ~10% in the mean wind speed at the ten selected stations.
(2) The correct formula for the amplitude A is
A = alpha x (rho12 - rho00)/2
where the dividing factor 2 was omitted in the text (paragraph 26). This was just a typo in the text.
(3) Fixed a bug that sometimes caused spurious discontinuities in the V80 trend at 00 and 12 UTC.
(4) Checked the effect of negative amplitudes A.

Other changes:
(1) Added data from 51 buoys and from other stations.
(2) Added more checks for quality control.
(3) Optimized all codes.

Based on these changes, the percent of U.S. stations with mean annual wind speeds >=6.9 m/s at 80 m is lower than in the original study (21% versus 24%), and the number of coastal/offshore stations with such winds is larger than in the original study (39% versus 37%). Below are a revised abstract, revised figures, and revised tables for the paper.

Revised abstract

This is a study to quantify U.S. wind power at 80 m (the hub height of large wind turbines) and to investigate whether winds from a network of farms can provide a steady and reliable source of electric power. Data from 1587 surface stations and 97 soundings in the U.S. for the year 2000 were used. Several methods were tested to extrapolate 10-m wind measurements to 80 m. The most accurate, a least-squares fit based on twice-a-day wind profiles from the soundings, resulted in 80-m wind speeds that are, on average, 0.3-0.5 m/s faster than those obtained from the most common methods previously used to obtain elevated data for U.S. windpower maps, a logarithmic law and a power law, both with constant coefficients. The results suggest that U.S. windpower at 80 m may be substantially greater than previously estimated. It was found that 21% of all stations (and 39% of all coastal/offshore stations) are characterized by mean annual speeds >=6.9 m/s at 80 m, implying that the winds over possibly one fifth of the U.S. are strong enough to provide electric power at a direct cost equal to that of a new natural gas or coal power plant. The greatest previously uncharted reservoir of windpower in the continental U.S. is offshore and near shore along the southeastern and southern coasts. When multiple wind sites are considered, the number of days with no wind power and the standard deviation of the wind speed, integrated across all sites, are substantially reduced in comparison with when one wind site is considered. Therefore a network of wind farms in locations with high annual mean wind speeds may provide a reliable and abundant source of electric power.

Map of mean 80-m wind speeds for year 2000

Continental U.S.


Legend:
speed<5.9 m/s (class 1 at 80 m)
5.9<=speed<6.9 m/s (class 2 at 80 m)
6.9<=speed<7.5 m/s (class 3 at 80 m)
7.5<=speed<8.1 m/s (class 4 at 80 m)
8.1<=speed<8.6 m/s (class 5 at 80 m)
8.6<=speed<9.4 m/s (class 6 at 80 m)
speed>=9.4 m/s (class 7 at 80 m)
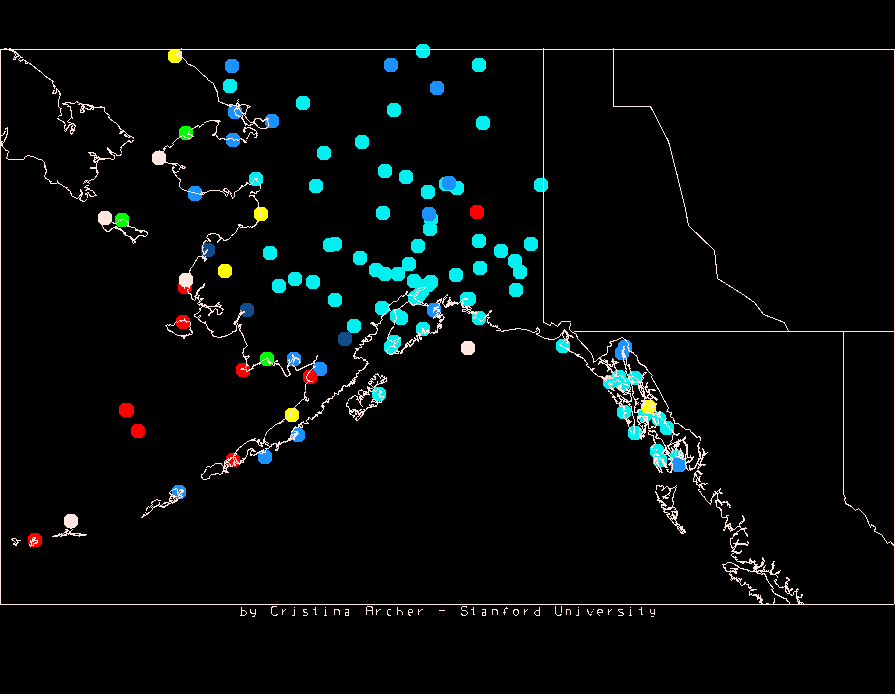
Map of mean annual wind speeds obtained from 1587 surface stations and 99 soundings in the U.S. in 2000. This map gives only information about the specific locations where measurements were taken. No interpolation or modeling was used, and the map should not be used to infer winds at locations other than the measurement stations, since wind speeds can change quite a bit over even a few kilometers. Sounding and surface data are extrapolated to 80 m above ground using a new methodology, entirely based on measurements, described in the paper. All data were obtained from NCDC and FSL. A new version of this map is available here.

Alaska

Hawaii

Postscript version available here Postscript version available here
Legend:
speed<5.9 m/s (class 1 at 80 m)
5.9<=speed<6.9 m/s (class 2 at 80 m)
6.9<=speed<7.5 m/s (class 3 at 80 m)
7.5<=speed<8.1 m/s (class 4 at 80 m)
8.1<=speed<8.6 m/s (class 5 at 80 m)
8.6<=speed<9.4 m/s (class 6 at 80 m)
speed>=9.4 m/s (class 7 at 80 m)
Legend:
speed<5.9 m/s (class 1 at 80 m)
5.9<=speed<6.9 m/s (class 2 at 80 m)
6.9<=speed<7.5 m/s (class 3 at 80 m)
7.5<=speed<8.1 m/s (class 4 at 80 m)
8.1<=speed<8.6 m/s (class 5 at 80 m)
8.6<=speed<9.4 m/s (class 6 at 80 m)
speed>=9.4 m/s (class 7 at 80 m)
The Alaska map includes data from 130 surface stations and 14 sounding locations. The Hawaii map includes data from 16 surface/offshore stations. Sounding and surface data are extrapolated to 80 m by using a new methodology, based on the least square fitting, described in the paper. All data were obtained from NCDC and FSL.

Table 2. U.S. states with the highest number of stations in class >=3 at 80 m, with emphasis on the number of offshore/coastal sites. .5 0
StateTotal No. of stations No. of Class >=3 stations Percent of Class >=3 stations No. of coastal/offshore stations No. of coastal/offshore class >=3 stations Percent of coastal/offshore class >=3 stations Percent of class >=3 stations that are coastal/offshore
Alaska1443725.7783038.581.1
Texas873135.610990.029.0
Kansas292172.4000.00.0
Nebraska302376.7000.00.0
Minnesota732027.4000.00.0
Oklahoma241979.2000.00.0
Iowa471736.2000.00.0
South Dakota221254.5000.00.0
Florida66710.639512.871.4
California11076.44012.514.3
New York37718.98562.571.4
North Dakota12866.7000.00.0
Ohio30826.7000.00.0
North Carolina38821.111763.687
Virginia41614.67228.633.3
Missouri20630.0000.00.0
Lousiana29620.77457.166.7
New Jersey12541.74250.040.0
Massachussetts21623.811436.480.0
Connecticut8337.533100.0100.0
Washington4137.312216.766.7
Maryland11327.36233.366.7
Delaware3133.311100.0100.0
Rhode Island5240.04250.0100.
Hawaii2015.01915.3100.0
Alabama2214.52150.0100.0
South Carolina1815.64125.0100.0
Pacific Islands8675.08675.0100.0
Buoys514486.3514486.3100.0
Other states625335.318211.16.1
Total U.S.168435120.834313439.138.2

Table 3. Number (and percent with respect to each region) of U.S. stations falling into each wind power class at 80 m. Stations are grouped into eleven regions. 8
RegionTotalWind Class at 80 m
12 335 67>=3
V< 5.9 m/s5.9<=V< 6.9 m/s 6.9<=V< 7.5 m/s7.5<=V< 8.1 m/s8.1<=V< 8.6 m/s 8.6<=V< 9.4 m/sV>=9.4 m/sV>=6.9 m/s
##%#%#% #%#%#%#% #%
North-West23120990.5146.141.7 10.410.410.410.4 83.5
North-Central1804525.05530.63016.7 3016.7116.110.600.0 8044.4
Great Lakes1618955.35332.9138.1 31.921.210.600.0 1911.8
North-East1478054.43825.9149.5 96.132.021.410.7 2919.7
East-Central1289574.21511.7118.6 32.310.800.032.3 1814.1
South-East15512480.02214.231.9 00.031.931.900.0 95.8
South-Central2138238.54722.12813.1 2511.7178.083.862.8 8439.4
Southern Rockies1128777.71614.310.9 76.300.010.900.0 98.0
South-West13111587.896.932.3 32.310.800.000.0 75.3
Alaska1448861.11913.25.6 85.674.9117.632.1 3725.7
Hawaii201470.0525.000.0 00.015.000.000.0 15.0
Pacific Islands11327.3218.219.1 218.219.1218.200.0 654.5
Buoys5147.835.935.9 35.923.91121.62549.0 4486.3
Total U.S.1684103561.529817.71277.5 945.6503.0412.4392.3 35120.8

Table 5. List of selected stations and corresponding mean properties at 80 m. Values from the paper are compared against the new results obtained by allowing negative values of amplitude A (as in the paper) or by taking only the absolute value of A.
StationState Annual Mean Speed (m/s) Annual Wind Standard Deviation (m/s) Wind Power Class Annual Mean Wind Power (W/m²) Annual Power Standard Deviation (W/m²)
PaperAabs(A) PaperAabs(A) PaperAabs(A) PaperAabs(A) PaperAabs(A)
AMATX10.38.88.84.94.54.5766 1169819808189918471846
CAONM10.18.88.75.95.55.4766 143710541020409327612884
CDBAK13.610.710.78.56.66.7777 376618471843760743174359
CSMOK10.89.39.35.54.64.6766 1463893984245513931407
DDCKS10.18.78.65.44.84.6766 1242845802241420902049
GCKKS9.98.68.55.64.84.7765 1304851813329725742539
GDPTX14.814.214.28.78.88.8777 447643064326880496619707
HBROK10.89.39.35.64.84.8766 1461924924223314581468
RSLKS10.38.98.95.64.74.7766 1379859860305717071748
SDBCA11.210.910.86.36.36.3777 190017941784441047524762
In average, the new results are lower than the paper's ones. For mean wind speed, the average difference is -12.4% and for mean wind power -29.7%. Results obtained by forcing the amplitude A to be positive defined (column "abs(A)") do not substantially differ from those obtained without such constraint. The average difference for wind speed is -0.44% and that for wind power is -1.42%.

Hourly trends: Mean 80-m wind speeds and standard deviations

AMA = Amarillo (TX) CAO = Clayton (NM)
CDB = Cold Bay (AK) CSM = Clinton (OK)
DDC = Dodge City (KS) GCK = Garden City (KS)
GDP = Pine Springs (TX) HBR = Hobart (OK)
RSL = Russell (KS) SDB = Sandberg (CA)
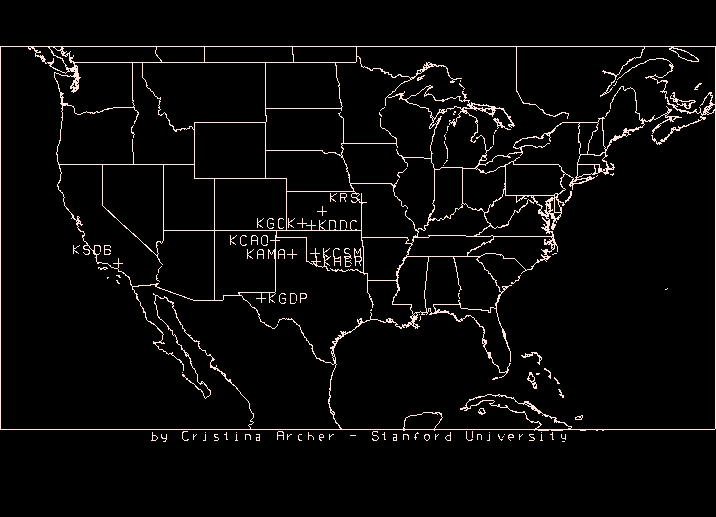
These stations were selected based on both wind power class (4 or higher) and hourly data availability (from NCDC). A map showing the locations of the selected stations is below. The plots show the mean hourly trend, month by month, of 10-m wind speed [V(10)], 80-m wind speed [V(80)], and the ratio V(80)/V(10) obtained with the methodology described in the paper. The value of V(80) directly calculated from the Least Square methodology is shown too, only for those hours for which sounding data were available from any of 5 surrounding stations.

Map of selected stations (except CDB)


This map is available in Postscript format here

10-m wind speed distributions - by month

AMA = Amarillo (TX) CAO = Clayton (NM)
CDB = Cold Bay (AK) CSM = Clinton (OK)
DDC = Dodge City (KS) GCK = Garden City (KS)
GDP = Pine Springs (TX) HBR = Hobart (OK)
RSL = Russell (KS) SDB = Sandberg (CA)
These plots show the actual distribution of 10-m winds speeds for the 10 stations mentioned above. The speed values at 80 m can be calculated with the methodology described in the paper. The vertical axis shows the frequency, during the year, of a certain value of wind speed. This number corresponds approximately to the number of hours (frequency) each wind speed was observed for, being the data approximately 1-hour averages. The adverb "approximately" is necessary because sometimes a station would report data more often than once an hour.

10-m wind speed distributions - by hour

AMA = Amarillo (TX) CAO = Clayton (NM)
CDB = Cold Bay (AK) CSM = Clinton (OK)
DDC = Dodge City (KS) GCK = Garden City (KS)
GDP = Pine Springs (TX) HBR = Hobart (OK)
RSL = Russell (KS) SDB = Sandberg (CA)
These plots show the 10-m wind speed statistical distributions for each hour of the day, averaged over the entire 2000 year.

80-m wind power trends - by month

AMA = Amarillo (TX) CAO = Clayton (NM)
CDB = Cold Bay (AK) CSM = Clinton (OK)
DDC = Dodge City (KS) GCK = Garden City (KS)
GDP = Pine Springs (TX) HBR = Hobart (OK)
RSL = Russell (KS) SDB = Sandberg (CA)
For each month of the year, a plot shows the 80-m mean wind power distributions for each hour of the day, together with the corresponding mean speed and Rayleigh wind power. At the top of the page, the wind power distribution over all months is shown for each station.

80-m wind power trends - by hour

AMA = Amarillo (TX) CAO = Clayton (NM)
CDB = Cold Bay (AK) CSM = Clinton (OK)
DDC = Dodge City (KS) GCK = Garden City (KS)
GDP = Pine Springs (TX) HBR = Hobart (OK)
RSL = Russell (KS) SDB = Sandberg (CA)
Every three hours, 80-m mean speed, 80-m mean wind power, and 80-m wind power calculated according to the Rayleigh assumption are shown as a function of the month. Also, the overall yearly average is shown on the x-axis, right after the December value. The top plot represents an average for all hours, month by month.

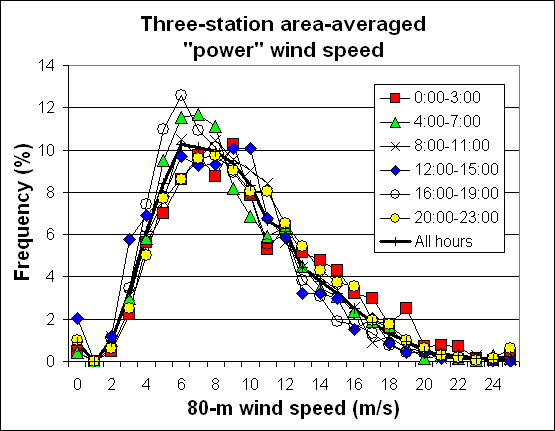
80-m wind speed (calculated from power) over increasingly larger areas

The larger the area over which wind power is obtained from, the lower the frequency of low or calm wind power events. To demonstrate this, mean wind speeds for one station (DDC), for three stations (over Kansas: DDC, RSL, and GCK), and for eight stations (over the Great Plains: AMA, DDC, GCK, GDP, RSL, HBR, and CAO) were calculated from power as follows. For each hour of the year 2000, wind speed data for each station were evaluated: if speeds were lower than a cut-off value of 3 m/s, then they were considered as zero. Area-averaged power was calculated for each hour and then the mean wind speed corresponding to such power was obtained. This is why the title of this paragraph says "calculated from power". The plots show that, as the area becomes larger and includes more stations (such as a network of wind farms as opposed to a single wind farm), the frequency of low wind speeds substantially decreases. The same applies for high wind speeds. Furthermore, looking at blocks of four hours each, the maximum power production (or maximum mean wind speed) is obtained for the 20:00-23:00 and 00:00-03:00 blocks. Finally, the standard deviation of wind speed is reduced as the number of farms is increased, i.e., the shape of the frequency distribution curve becomes "slimmer" and more similar to a Guassian curve than to a Rayleigh curve. This implies that, the greater the number of wind farms connected together, the lower the intermittency of wind power.

Conclusions

In this paper, a methodology for determining 80-m wind speeds given 10-m wind speed measurements was introduced and applied to the U.S. for the year 2000. The results were analyzed to judge the regularity and spatial distribution of U.S. windpower at 80 m. Conclusions of the study are as follows:
(1) In the year 2000, mean-annual wind speeds at 80 m may have exceeded 6.9 m/s at approximately 21% of the measurement stations in the U.S., implying that possibly one fifth of the country is suitable for providing electric power from wind at a direct cost equal to that from a new natural gas or coal power plant.
(2) The greatest previously uncharted reservoir of windpower in the continental U.S. is offshore and onshore along the southeastern and southern coasts.
(3) The other great wind reservoirs are the north- and south-central regions, charted previously.
(4) The five states with the highest percentage of stations with annual mean 80-m wind speed >= 6.9 m/s were Oklahoma, Nebraska, Kansas, North Dakota, and South Dakota.
(5) The standard deviation of the wind speed averaged over multiple locations is less than that at any individual location. As such, intermittency of wind energy from multiple wind farms may be less than that from a single farm, and contingency reserve requirements may decrease with increasing spatial distribution of wind farms.
(6) The minimum wind speed during the year increases when more wind sites are considered. Thus, the probability of no wind power production due to low wind speed events may be greatly reduced (if not eliminated) by a network of wind farms.
(7) Winds are Rayleigh in nature, and actual wind power at any hour of the day during a year is close to Rayleigh wind power.
(8) Because winds, even at a given hour, are Rayleigh in nature, the average wind power over a month at a given hour at a location is a reliable quantity compared with wind power at the same hour, but on any random day of the month. Therefore, requiring turbine owners to produce a summed quantity of energy over a month at a given hour of the day entails little risk once monthly-averaged Rayleigh wind speeds at the given hour and location are known.
(9) Even when the standard deviation of the wind speed is high, the total wind power during an averaging period follows the mean wind speed.

ACKNOWLEDGMENTS. This work was supported by the Environmental Protection Agency, the NASA New Investigator Program in Earth Sciences, the National Science Foundation, and the David and Lucile Packard Foundation and the Hewlett-Packard company. Data were obtained from: National Climatic Data Center, Forecast System Laboratory, and Pacific Northwest Laboratory. We would also like to thank Scott Archer, Gil Master, Paul Veers, Henry Dodd, and Donald Anderson for helpful comments.