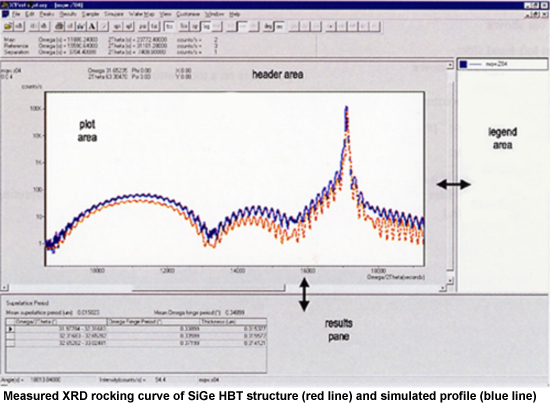
Rocking Curve Analysis
X'Pert Epitaxy is used to calculate layer thicknesses, lattice parameter differences between layer and substrate and layer compositions from rocking curves recorded from epitaxial samples.The simulation of rocking curves in X'Pert Epitaxy employs Tagaki-Taupin theory [1].
The fitting procedure used in X’Pert Epitaxy is based
on the method first described by Klappe and Fewster for ion implanted
samples.
The fitting method relies on smoothing the measured and simulated data
and matching the major peaks. The smoothing is then progressively decreased
allowing the minor peaks to be fitted.
1. Halliwell et al. J.
Cryst. Growth 68, 523 (1984).
2. Klappe and Fewster, J. Appl. Cryst., 27,
103 (1994).
X'Pert Epitaxy Quick Start Guide.
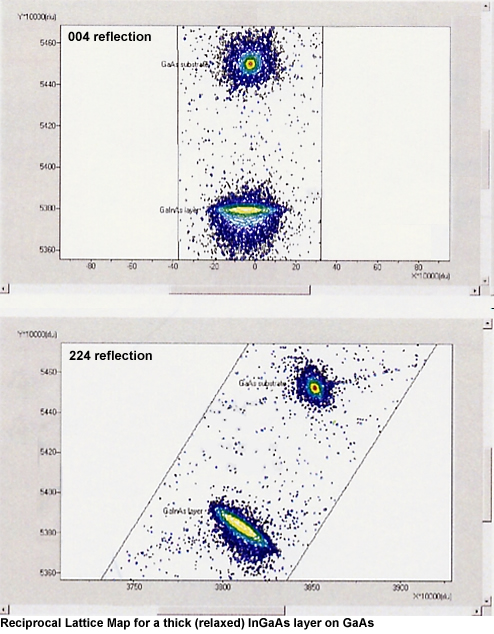
Reciprocal Space Maps
Designed for plotting and analyzing area scan data:
extraction of line scans
saving zoomed area as new file
projecting area scan onto single scan in vertical or horizontal axis
calculating of parallel and perpendicular mismatch from asymmetrical map
plotting more than one map in the same window