RP2-1
Table of contents
Model files
High-T model
High-T model (refit to 9999 K)
Model performance
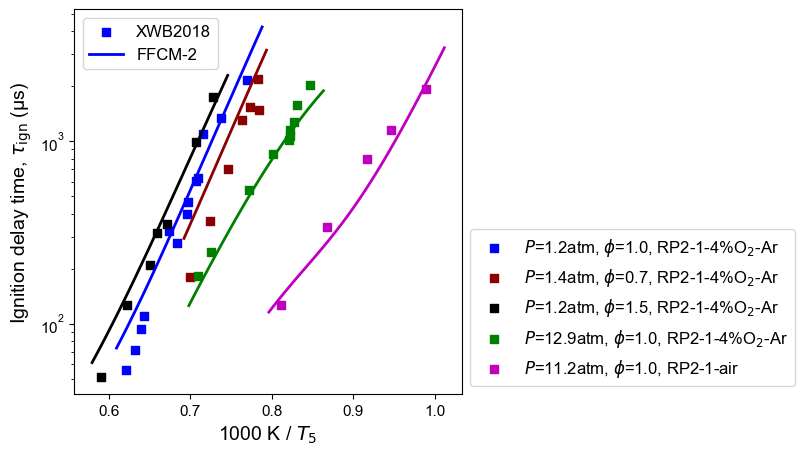
Figure 1: RP2-1 ignition delay time. Experimental measurement is from XWB2018: Xu et al. 1.
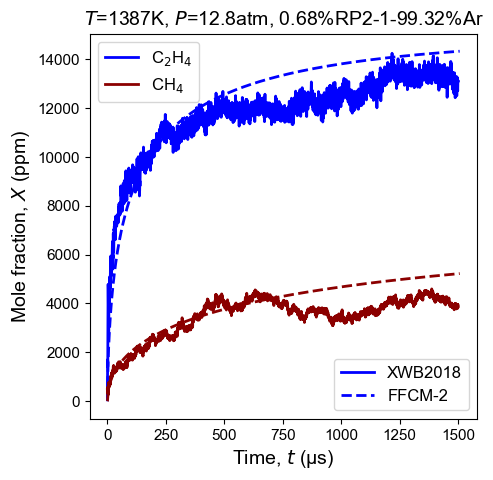
Figure 2: Time history of RP2-1 pyrolysis. Shock tube pyrolysis measurement is from XWB2018: Xu et al. 1.
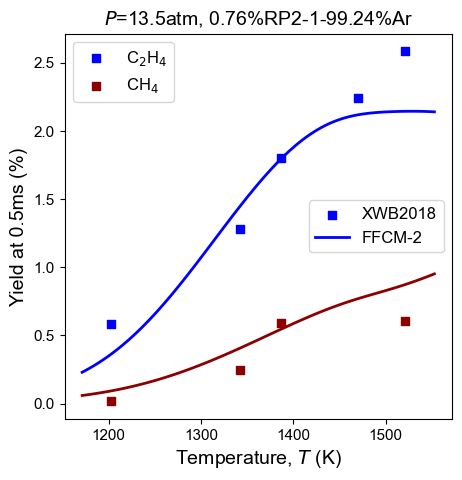
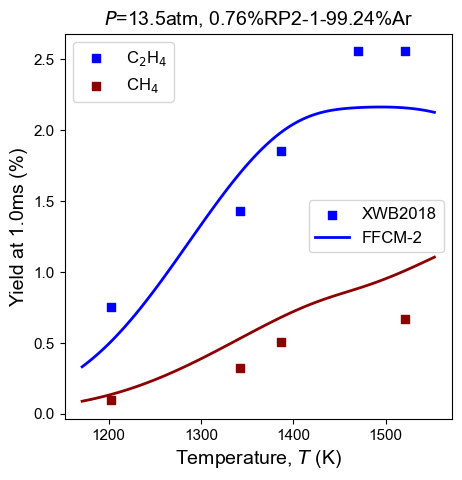
Figure 3: Yield of methane and ethylene from thermal decomposition of RP2-1. Shock tube pyrolysis measurement is from XWB2018: Xu et al. 1. Residence time: 0.5 ms (left panel), and 1.0 ms (right panel).
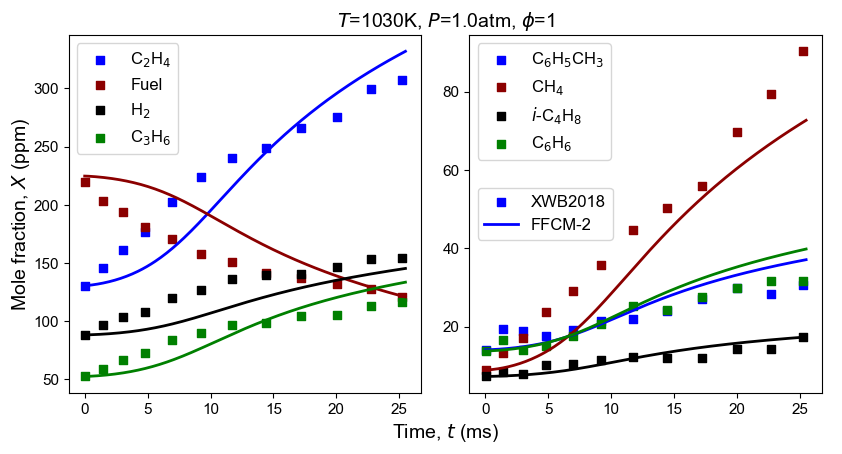
Figure 4: Time history of multiple species from RP2-1 oxidation. Flow reactor measurement is from XWB2018: Xu et al. 1.
References
-
Xu, R., Wang, K., Banerjee, S., Shao, J., Parise, T., Zhu, Y., Wang, S., Movaghar, A., Lee, D., Zhao, R., Han, X., Gao, Y., Lu, T., Brezinsky, K., Egolfopoulos, F., Davidson, D., Hanson, R., Bowman, C. T. & Wang, H. (2018). A physics-based approach to modeling real-fuel combustion chemistry–II. Reaction kinetic models of jet and rocket fuels. Combustion and Flame, 193, 520-537. ↩ ↩2 ↩3 ↩4