n-Dodecane
Table of contents
Model files
High-T model (detailed)
High-T model (detailed, refit to 9999 K)
High-T model (skeletal)
High-T model (skeletal, refit to 9999 K)
NTC-enabled model
Model performance
High temperature
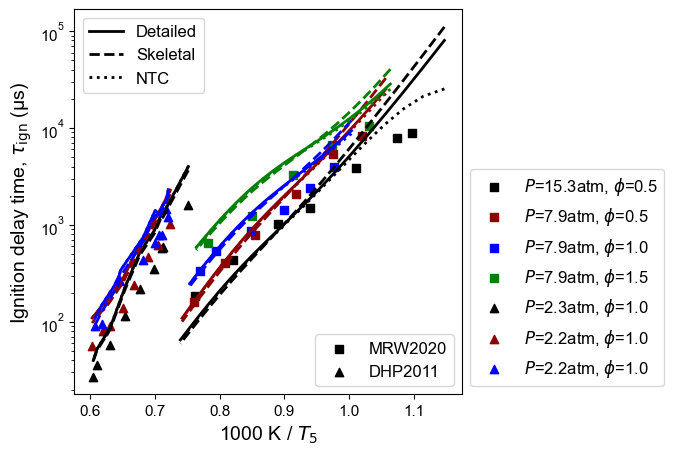
Figure 1: n-Dodecane ignition delay time at high temperature. Model predictions contain high-T detailed model, high-T skeletal model, and NTC-enabled model. Experimental measurements are from MRW2020: Mao et al. 1, and DHP2011: Davidson et al. 2.
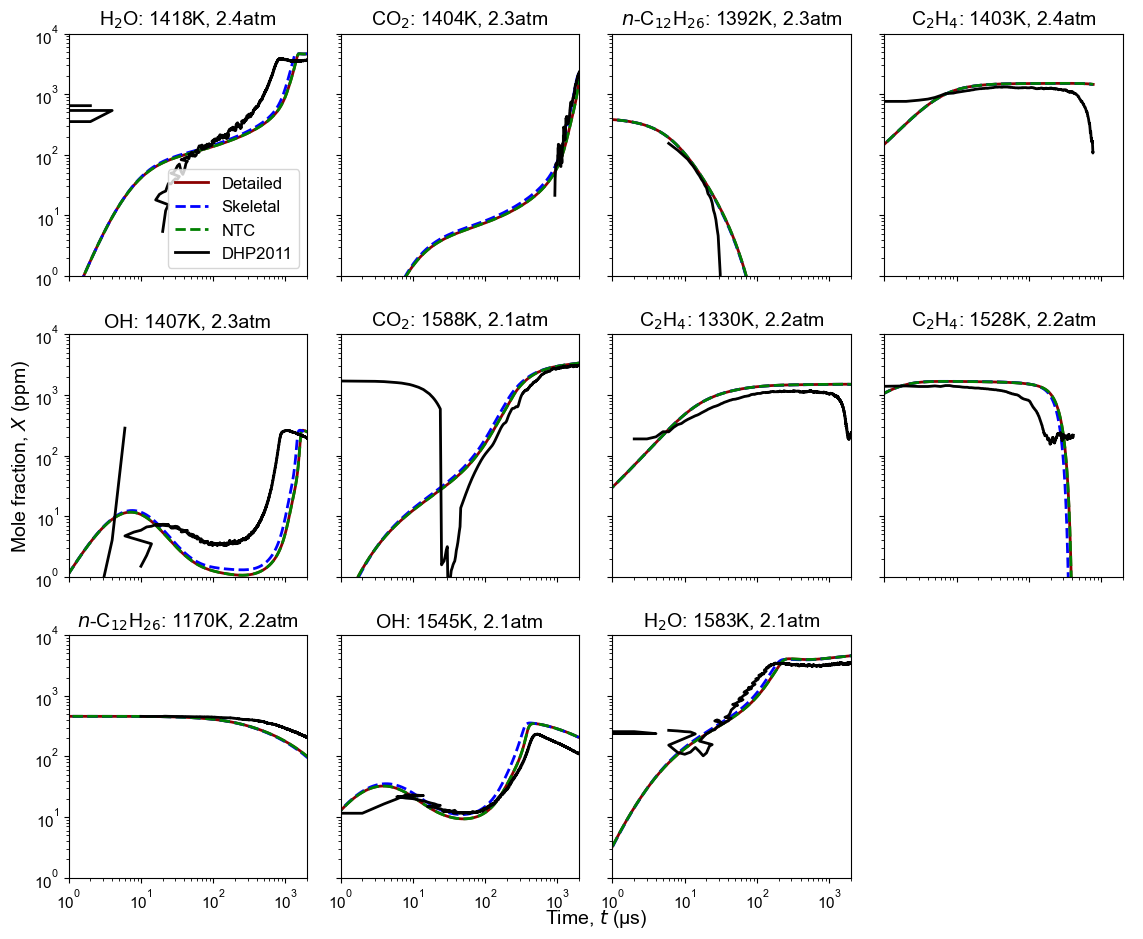
Figure 2: Time history of multiple species from oxidation of n-dodecane. Model predictions contain high-T detailed model, high-T skeletal model, and NTC-enabled model. Shock tube oxidation measurement is from DHP2011: Davidson et al. 2. Initial condition: tempearture and pressure are listed on each subplots, $\phi$=1, $n$-C12H26/0.75%O2/Ar.
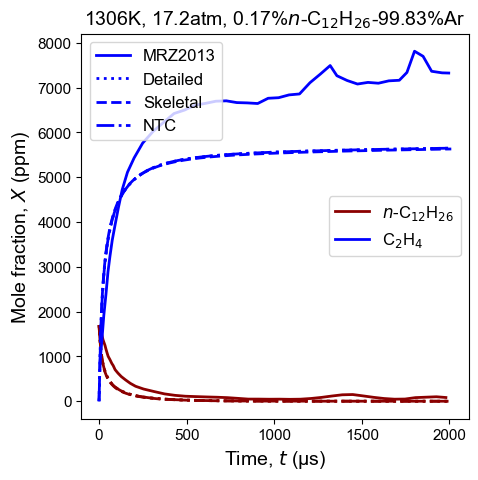
Figure 3: Species time history of n-dodecane and ethylene from thermal decomposition of n-dodecane. Model predictions contain high-T detailed model, high-T skeletal model, and NTC-enabled model. Shock tube pyrolysis measurement is from MRZ2013: MacDonald et al. 3. Initial condition: 1306 K, 17.2 atm, and 0.17%$n$-C12H26/99.83%Ar.
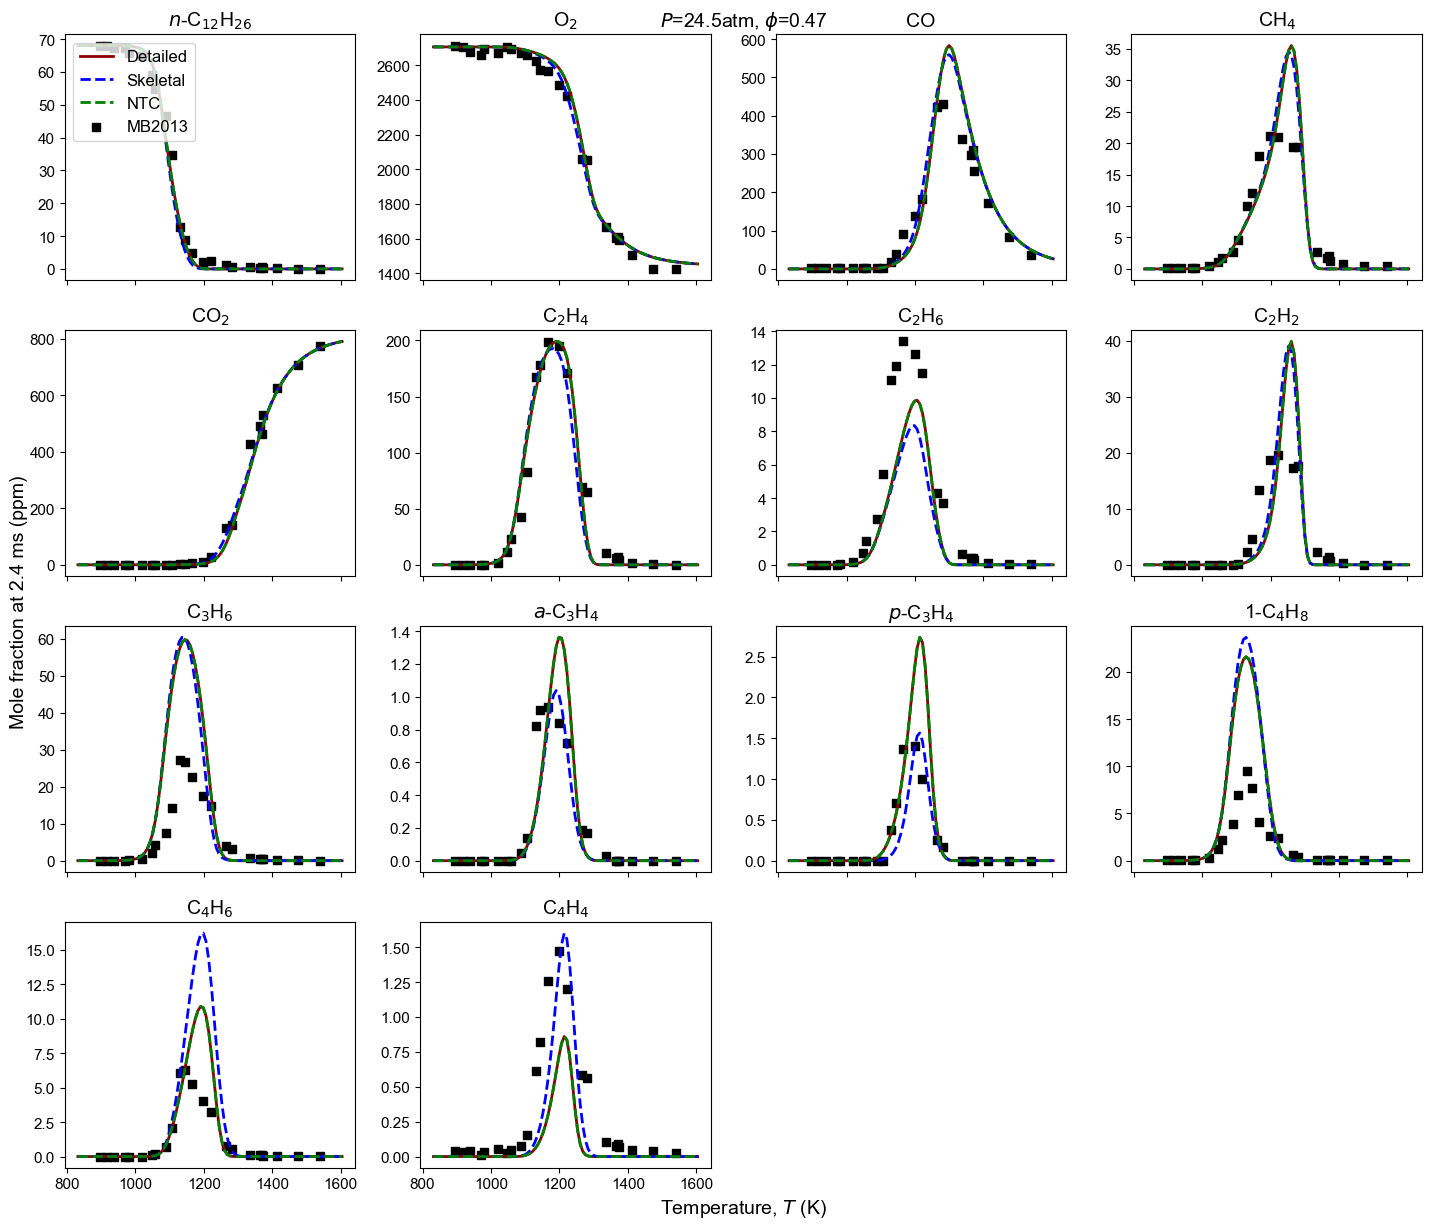
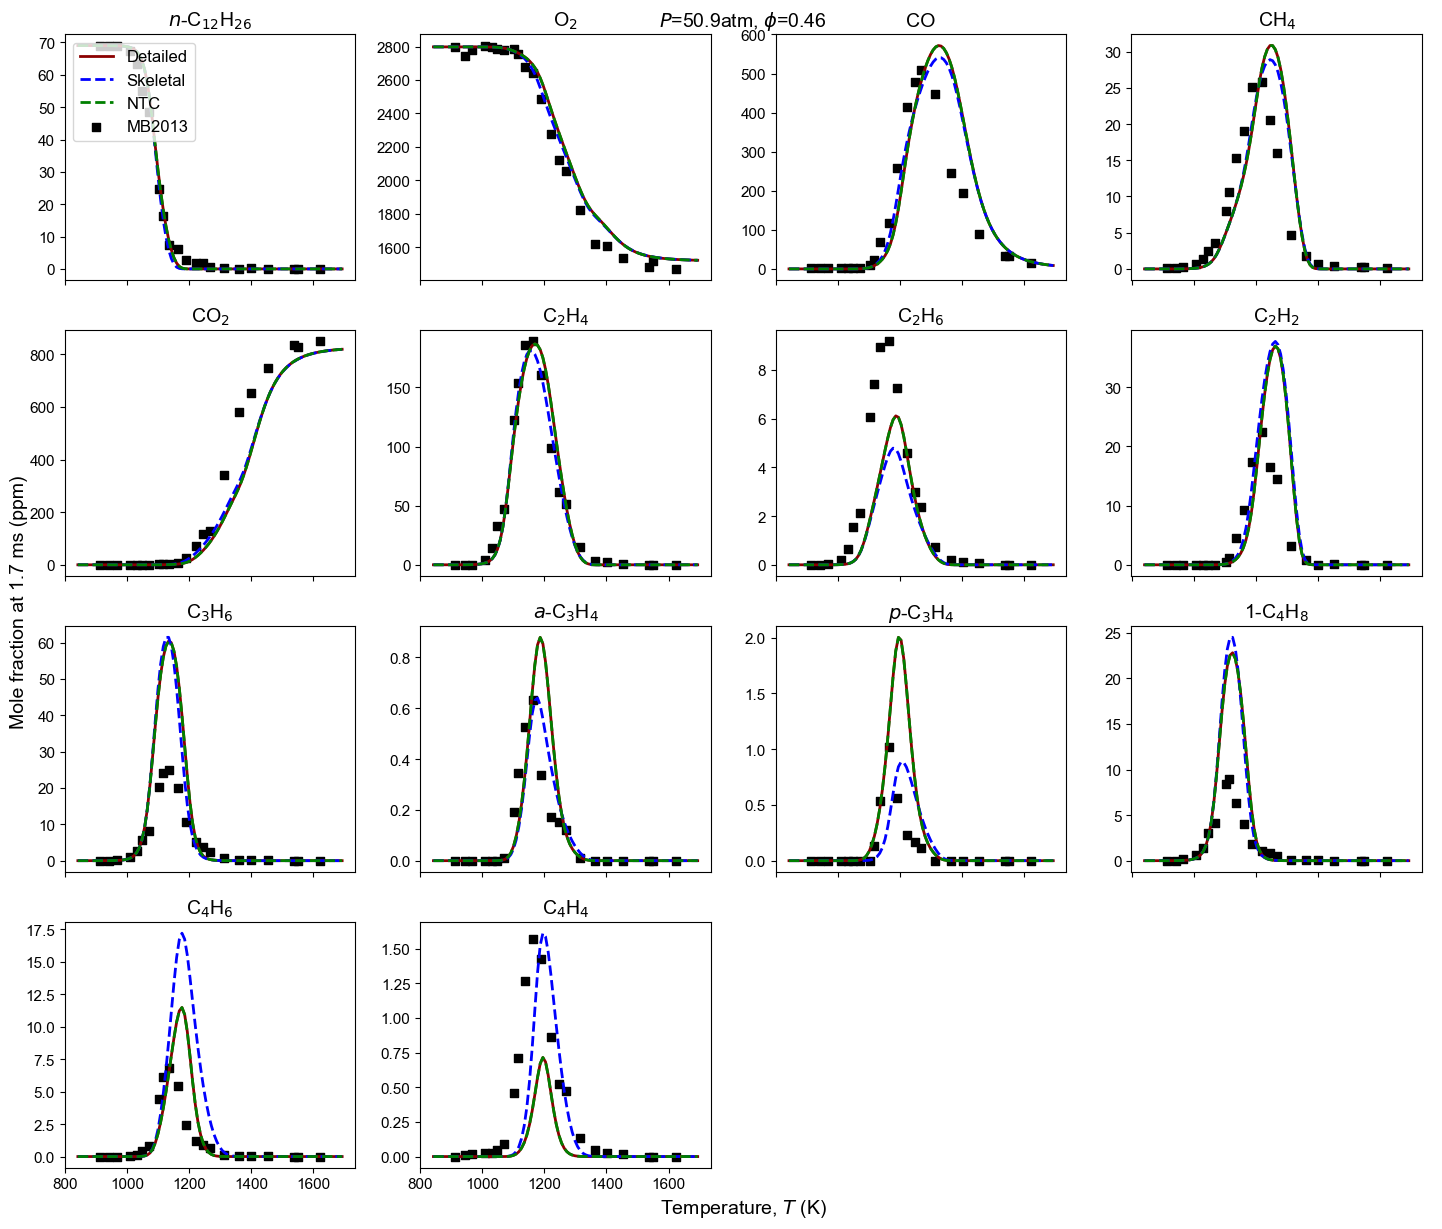
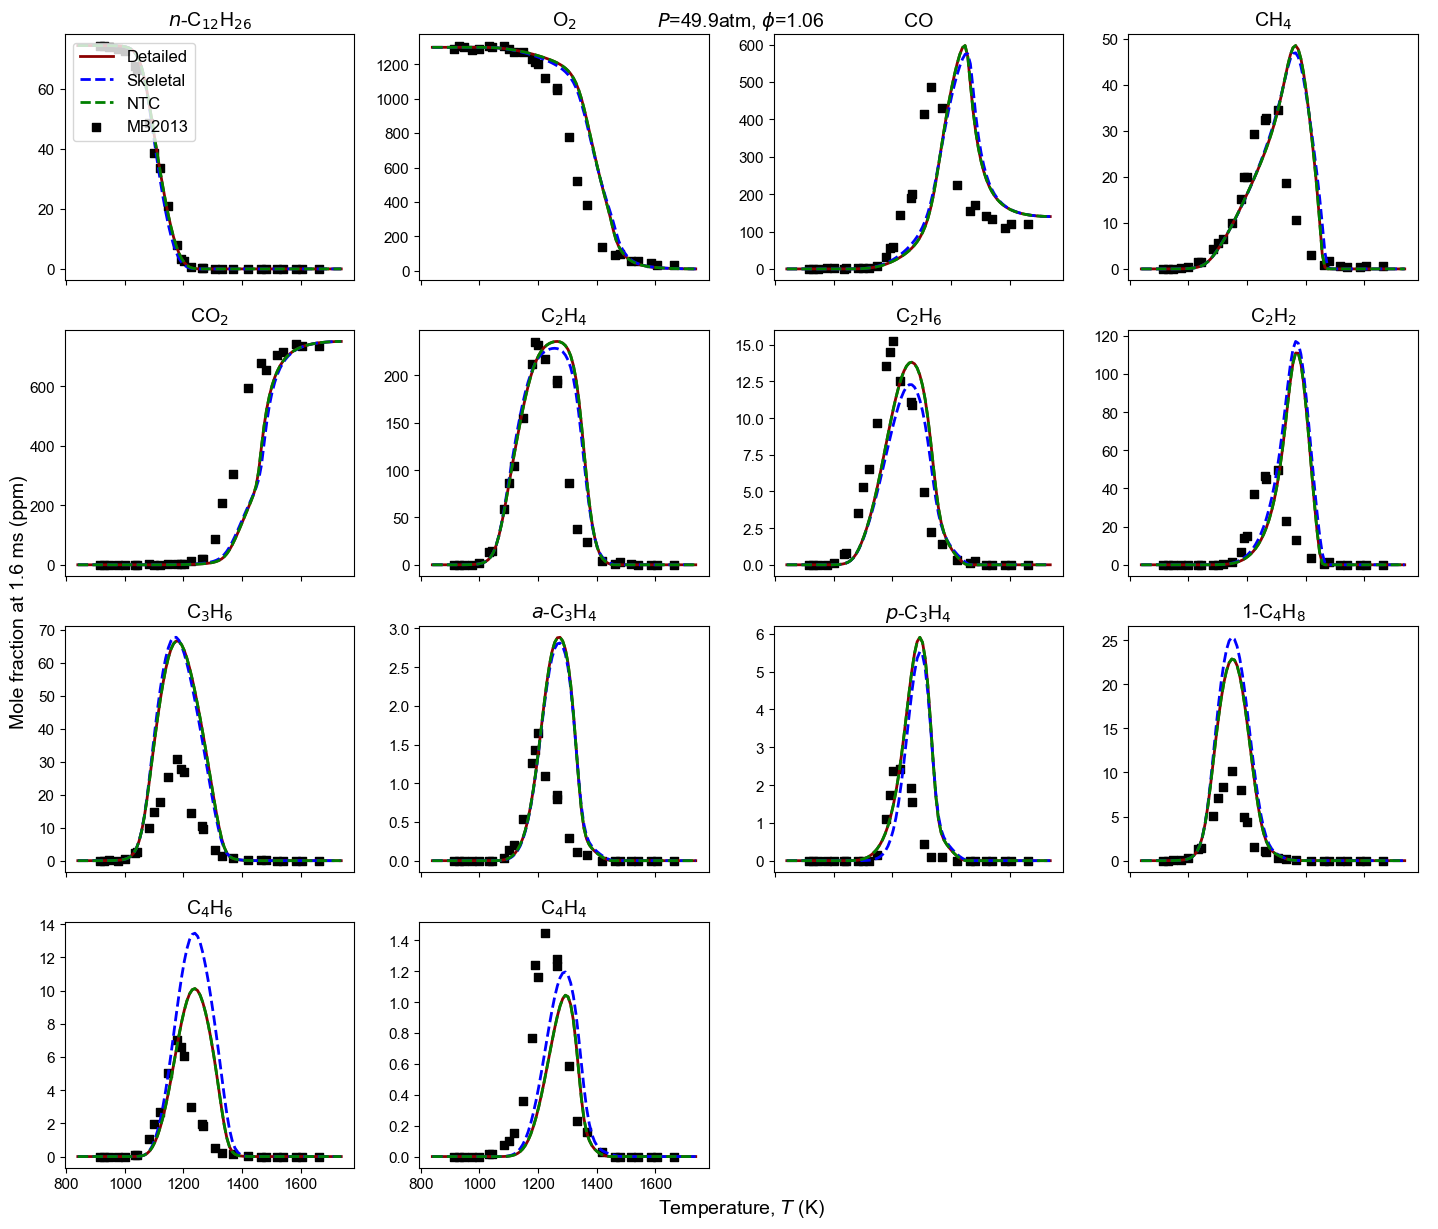
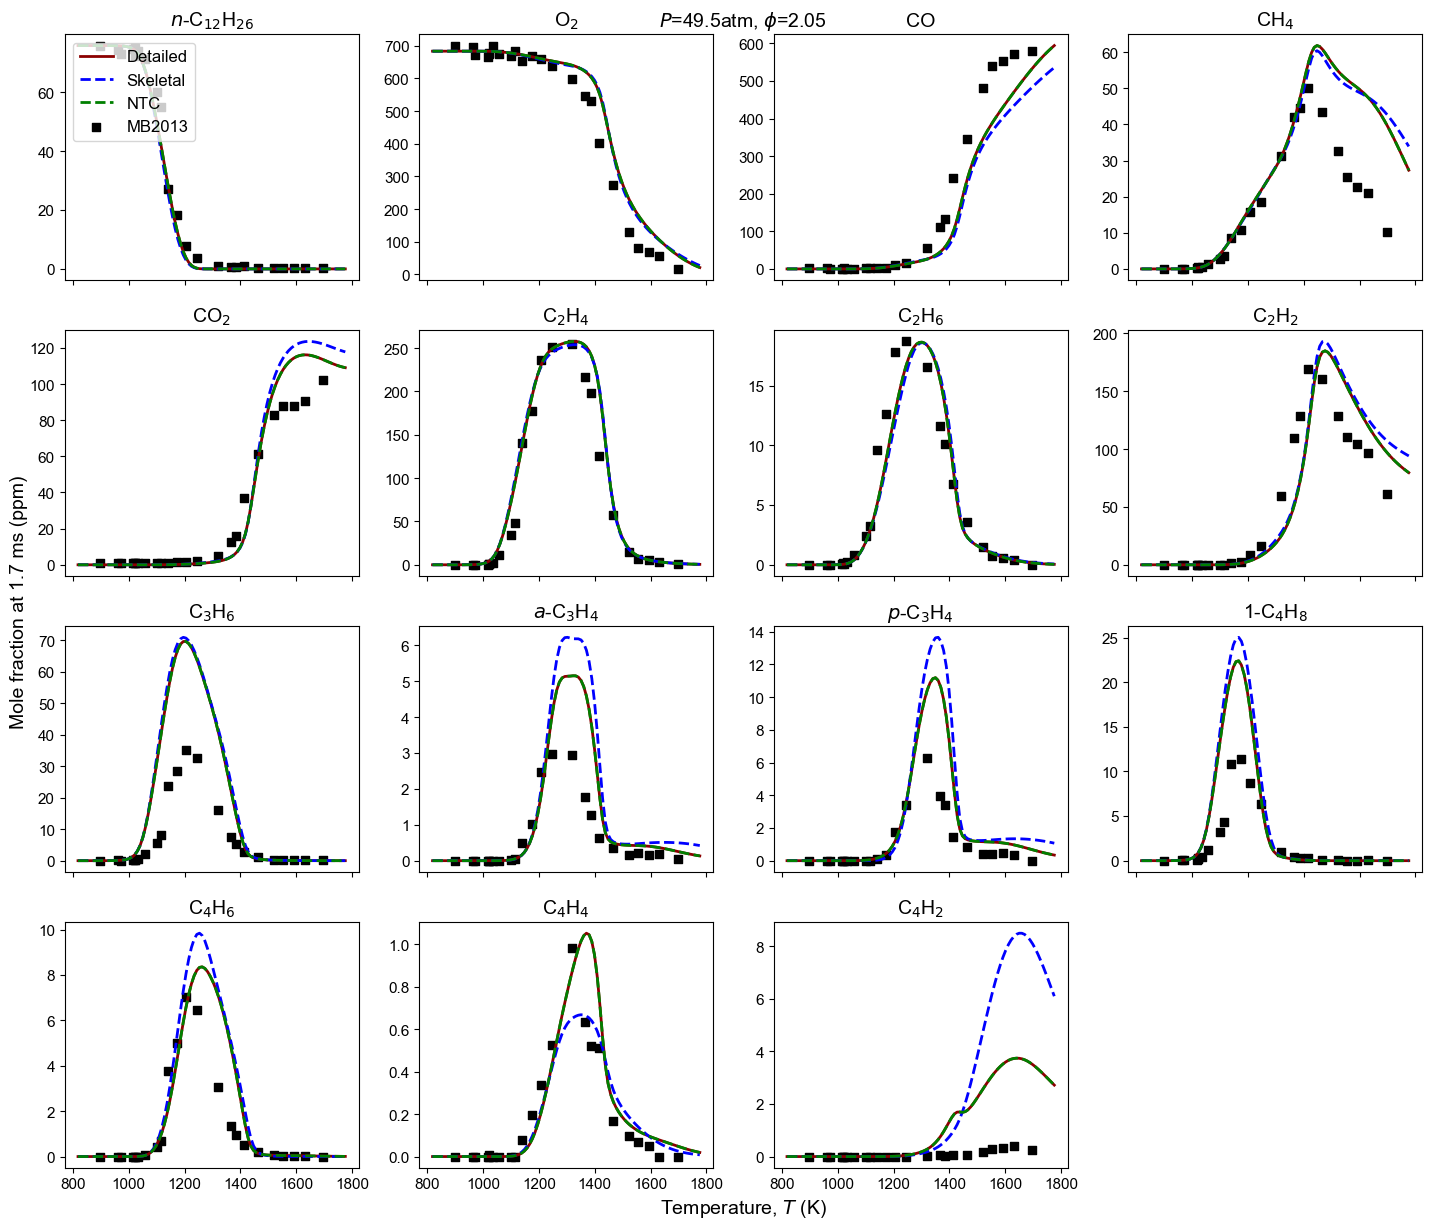
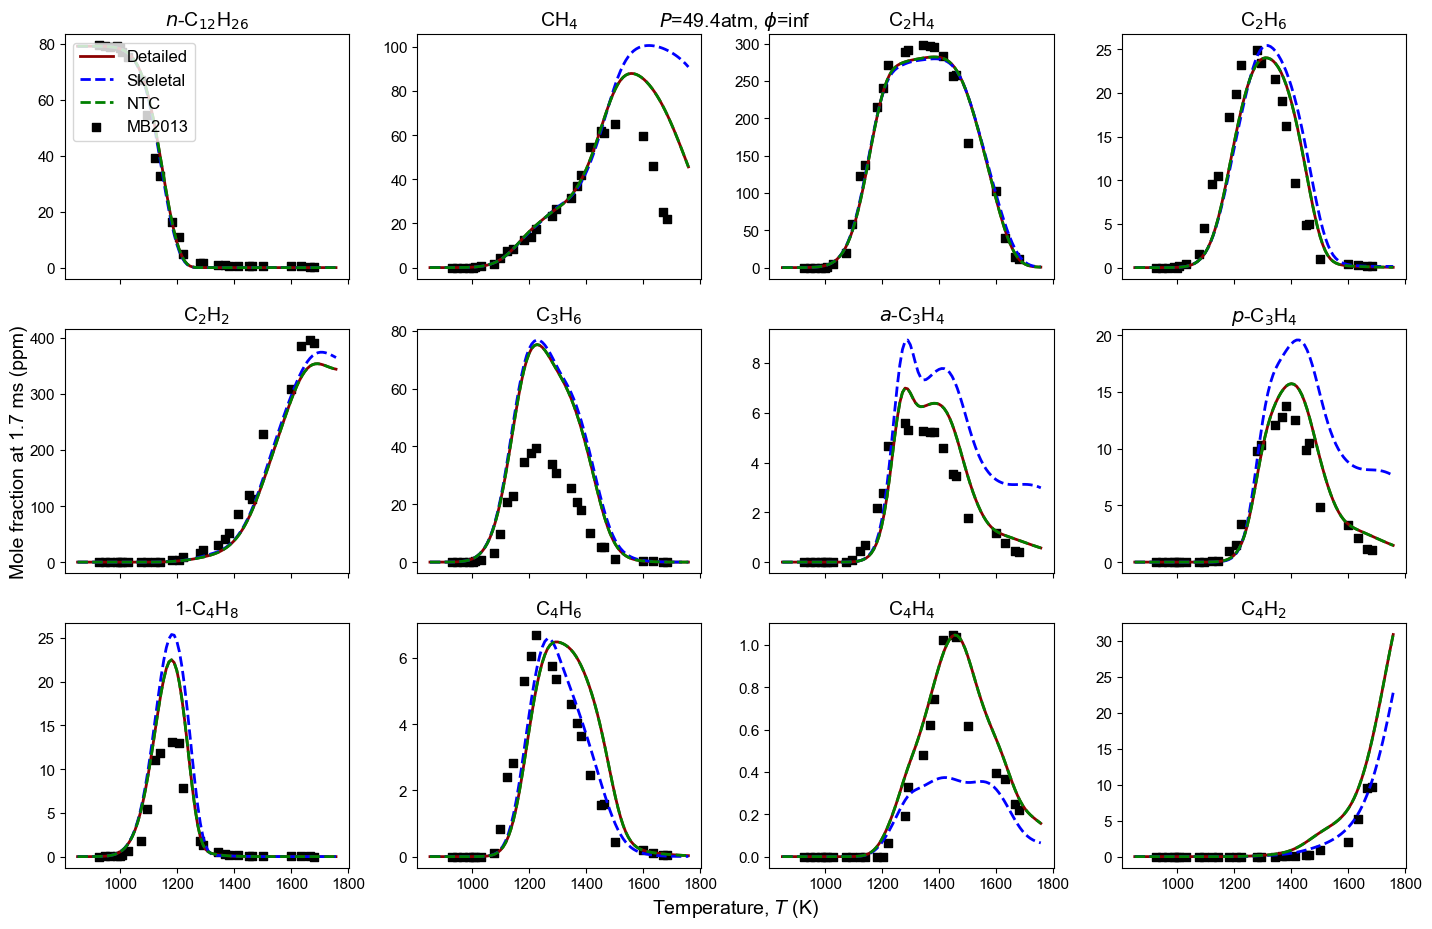
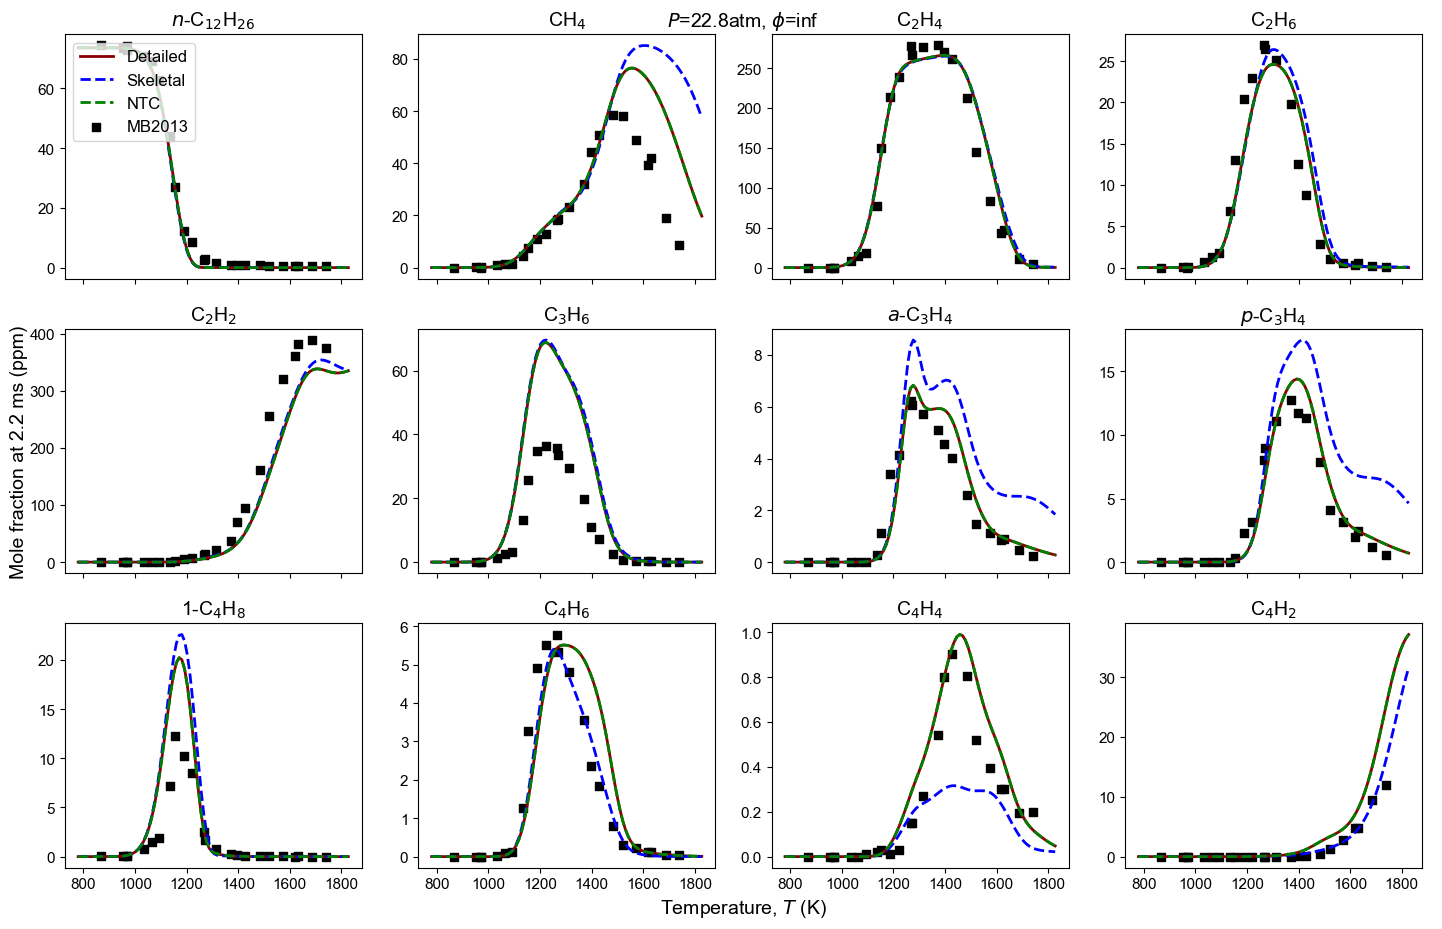
Figure 4: Yield of multiple species from n-dodecane oxidation and pyrolysis. Model predictions contain high-T detailed model, high-T skeletal model, and NTC-enabled model. Shock tube measurement is from MB2013: Malewicki and Brezinsky 4.
NTC
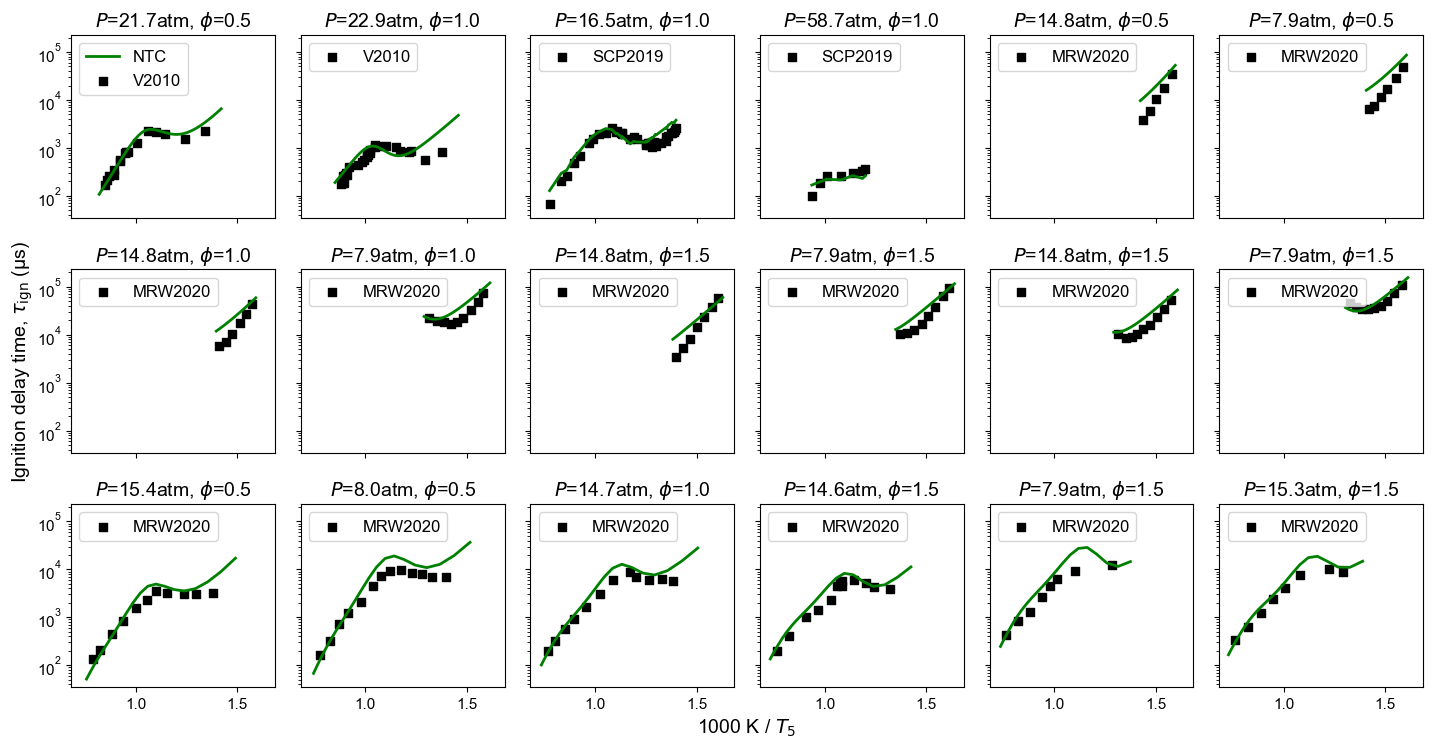
Figure 5: n-Dodecane ignition delay time extended to NTC-related temperature. Model predictions are from NTC-enabled model. Experimental measurements are from MRW2020: Vasu 5, Shao et al. 6, and Mao et al. 1.
Model reduction
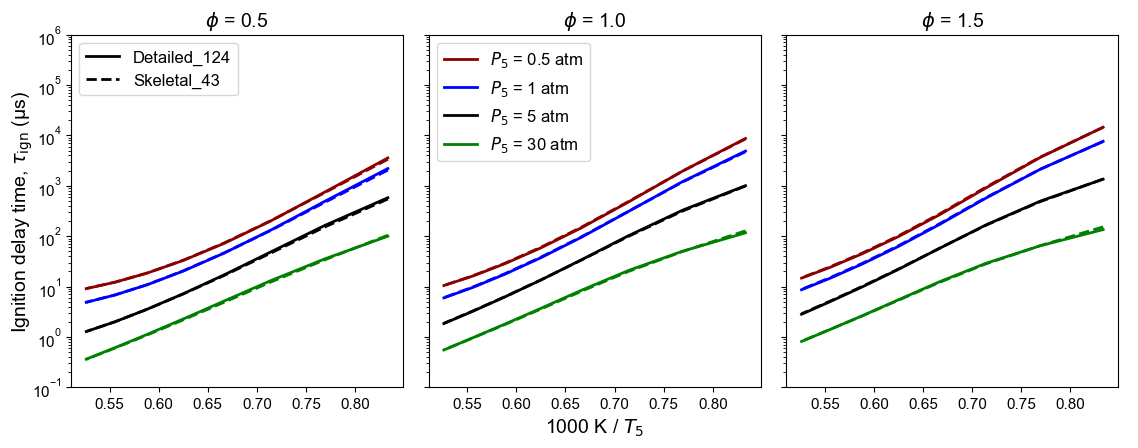
Figure 6: Comparison of detailed and skeletal model predictions of n-dodecane ignition delay time at high temperature. Initial conditions (used as DRG targets): $T_5$ from 1200 to 2000 K, $P_5$ = 0.5, 1, 5, 30 atm, and $\phi$ = 0.5, 1.0, 1.5.
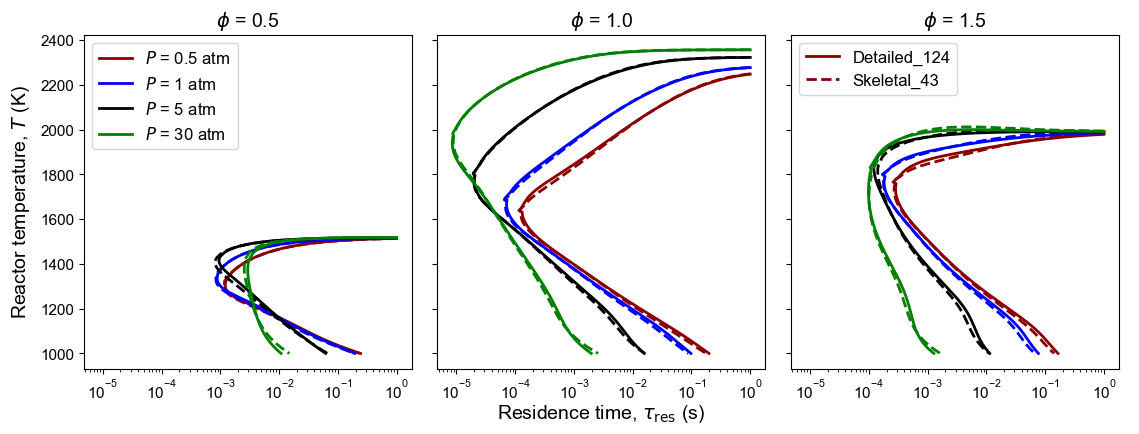
Figure 7: Comparison of detailed and skeletal model predictions of n-dodecane PSR S-curve. Initial conditions (used as DRG targets): $T_{in}$ = 300 K, $P$ = 0.5, 1, 5, 30 atm, and $\phi$ = 0.5, 1.0, 1.5.
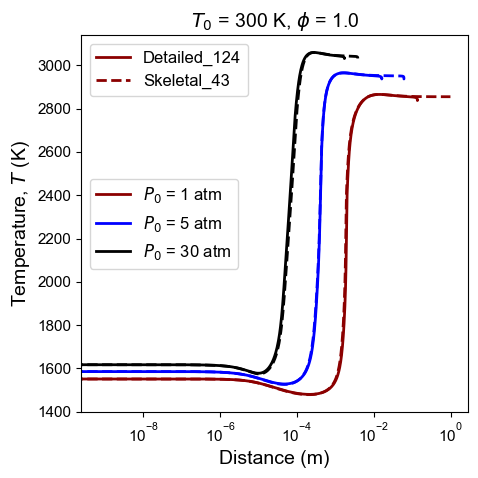
Figure 8: Comparison of detailed and skeletal model predictions of n-dodecane ZND temperature profile. Post shock conditions (not used as DRG targets, only for testing): $T_0$ = 300 K, $P_0$ = 1, 5, 30 atm, and $\phi$ = 1.0.
References
-
Mao, Y., Raza, M., Wu, Z., Zhu, J., Yu, L., Wang, S., Zhu, L. & Lu, X. (2020). An experimental study of n-dodecane and the development of an improved kinetic model. Combustion and Flame, 212, 388-402. ↩ ↩2
-
Davidson, D., Hong, Z., Pilla, G., Farooq, A., Cook, R. & Hanson, R. (2011). Multi-species time-history measurements during n-dodecane oxidation behind reflected shock waves. Proceedings of the Combustion Institute, 33 (1), 151-157. ↩ ↩2
-
MacDonald, M., Ren, W., Zhu, Y., Davidson, D. & Hanson, R. (2013). Fuel and ethylene measurements during n-dodecane, methylcyclohexane, and iso-cetane pyrolysis in shock tubes. Fuel, 103, 1060-1068. ↩
-
Malewicki, T. & Brezinsky, K. Experimental and modeling study on the pyrolysis and oxidation of n-decane and n-dodecane. Proceedings of the Combustion Institute, 34 (1), 361-368. ↩
-
Vasu, S. (2010). Measurements of ignition times, OH time-histories, and reaction rates in jet fuel and surrogate oxidation systems. Ph.D. Thesis. ↩
-
Shao, J., Choudhary, R., Peng, Y., Davidson, D. & Hanson, R. (2019). A shock tube study of n-heptane, iso-octane, n-dodecane and iso-octane/n-dodecane blends oxidation at elevated pressures and intermediate temperatures. Fuel, 243, 541-553. ↩