Summary Results
Table of contents
- Optimization and Uncertainty Minimization
- Parametric study for parameter freezing
- Optimized rate parameters
- Inconsistent targets
- Covariance matrix
Optimization and Uncertainty Minimization
Figure 1 shows the 1192 targets predicted by the trial and optimized FFCM-2 against the experimental values. The grey horizontal error bars represent data uncertainties, the blue and red vertical error bars present model prediction uncertainties (2-standard deviation). The optimized FFCM-2 exhibits improved agreement compared to the experimental data for all three categories of targets. The mean deviations for laminar flame speed, ignition delay time and species measurement decrease from 9.54%, 44.4% and 54.6% for the trial model to 7.02%, 27.4% and 20.9% for the optimized model, respectively. Similar observations are made for the maximum errors. Of equal importance, the optimized FFCM-2 substantially reduced prediction uncertainties. Before optimization, the trial model prediction uncertainties are comparable to or larger than the data uncertainties. After optimization, the uncertainties are reduced by as much as a factor of 10, and are in general smaller than the data uncertainties.
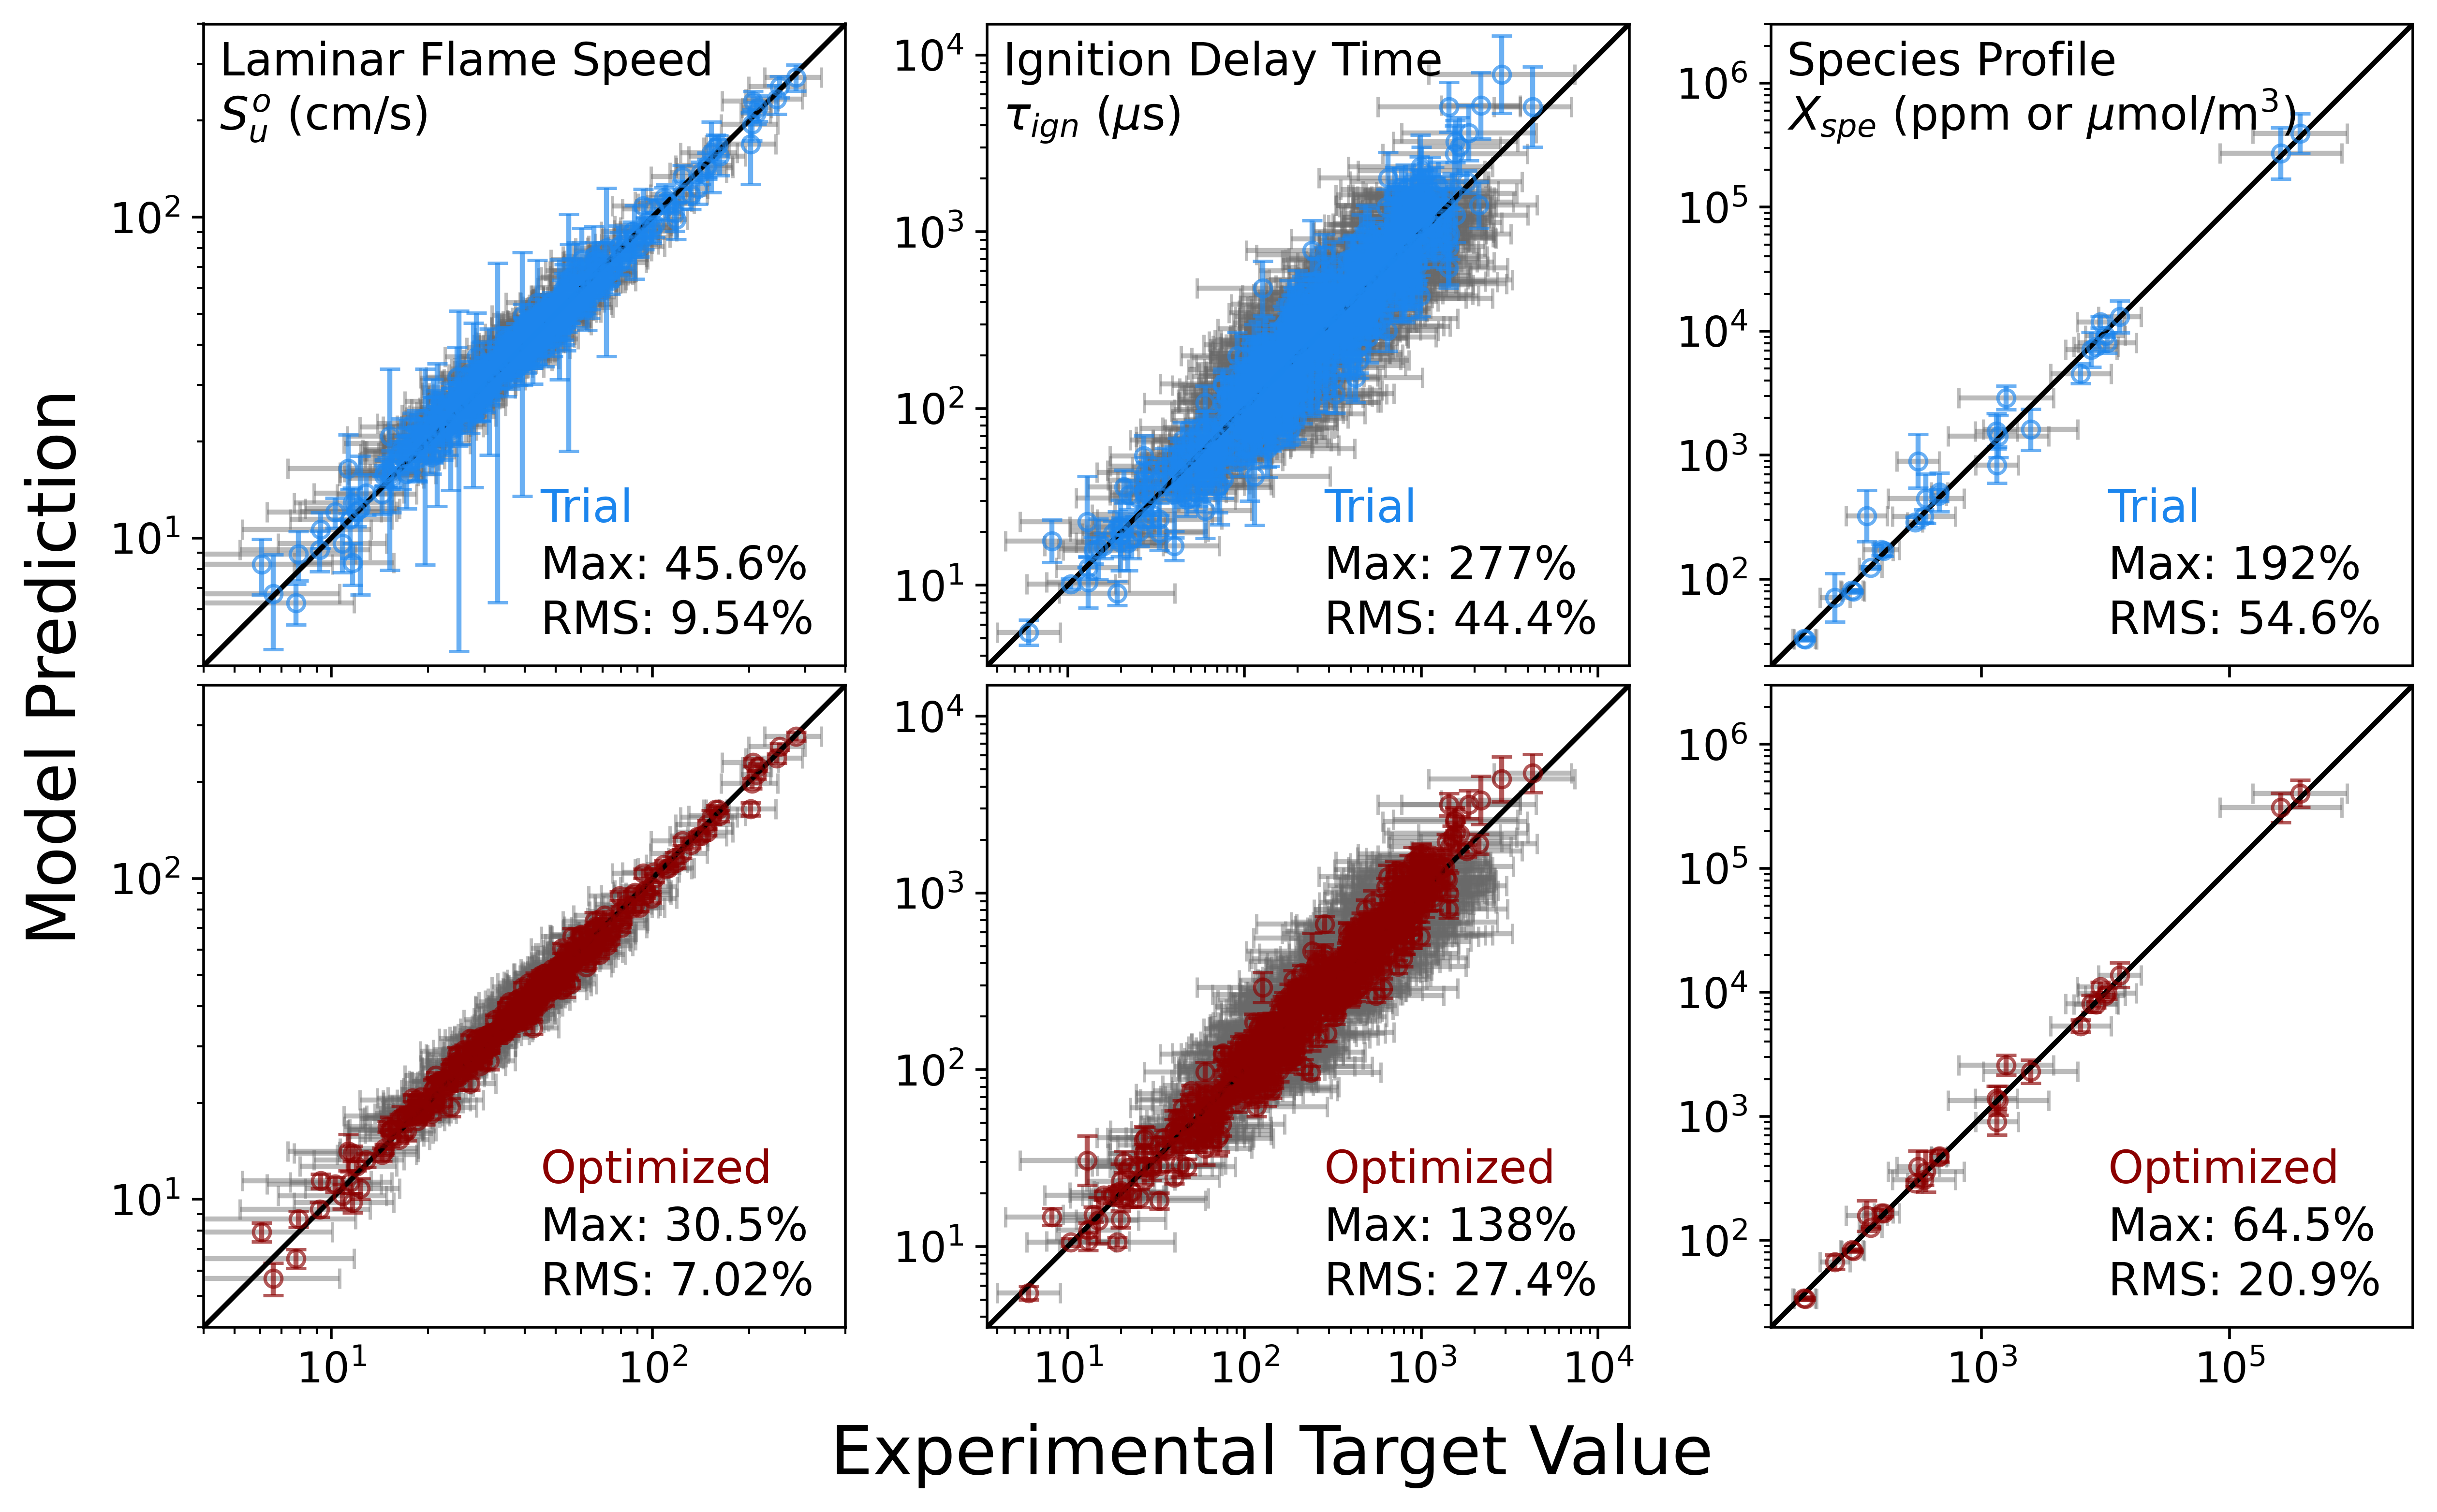
Figure 1 Trial and optimized model predictions and $2\sigma$ model uncertainties for the 1192 sets of targets in the current FFCM-2 study, compared to the experiments and $2\sigma$ data uncertainty; top row: trial FFCM-2; bottom row: optimized FFCM-2. In each panel, the maximum and RMS relative errors of the model and experiment are indicated.
Parametric study for parameter freezing
Figure 2 presents a parametric study on the threshold for parameter freezing. In the trial model, the $2\sigma$ uncertainty factor is 0.5. If we choose a fixed value of $\chi_{2\sigma} = 0.48$, the contribution of the optimized parameters with $2\sigma$ values larger than 0.48 is considered insignificant to the uncertainty minimization. As shown in Fig. 2, when varying the multiplier threshold $\chi_A$, the number of active parameters dropped dramatically while the value of the cost function of the experimental data (the first term of the objective function) increases only marginally. Herein, we considered $\chi_A = 0.05$ appropriate because the cost function value increases only by 0.8% but the number of active parameters dropped by 75%, from 1052 to 258. The parametric study demonstrates the effect sparsity of combustion reaction models. The full list of the 258 active parameters after freezing are listed in Active Parmeters.
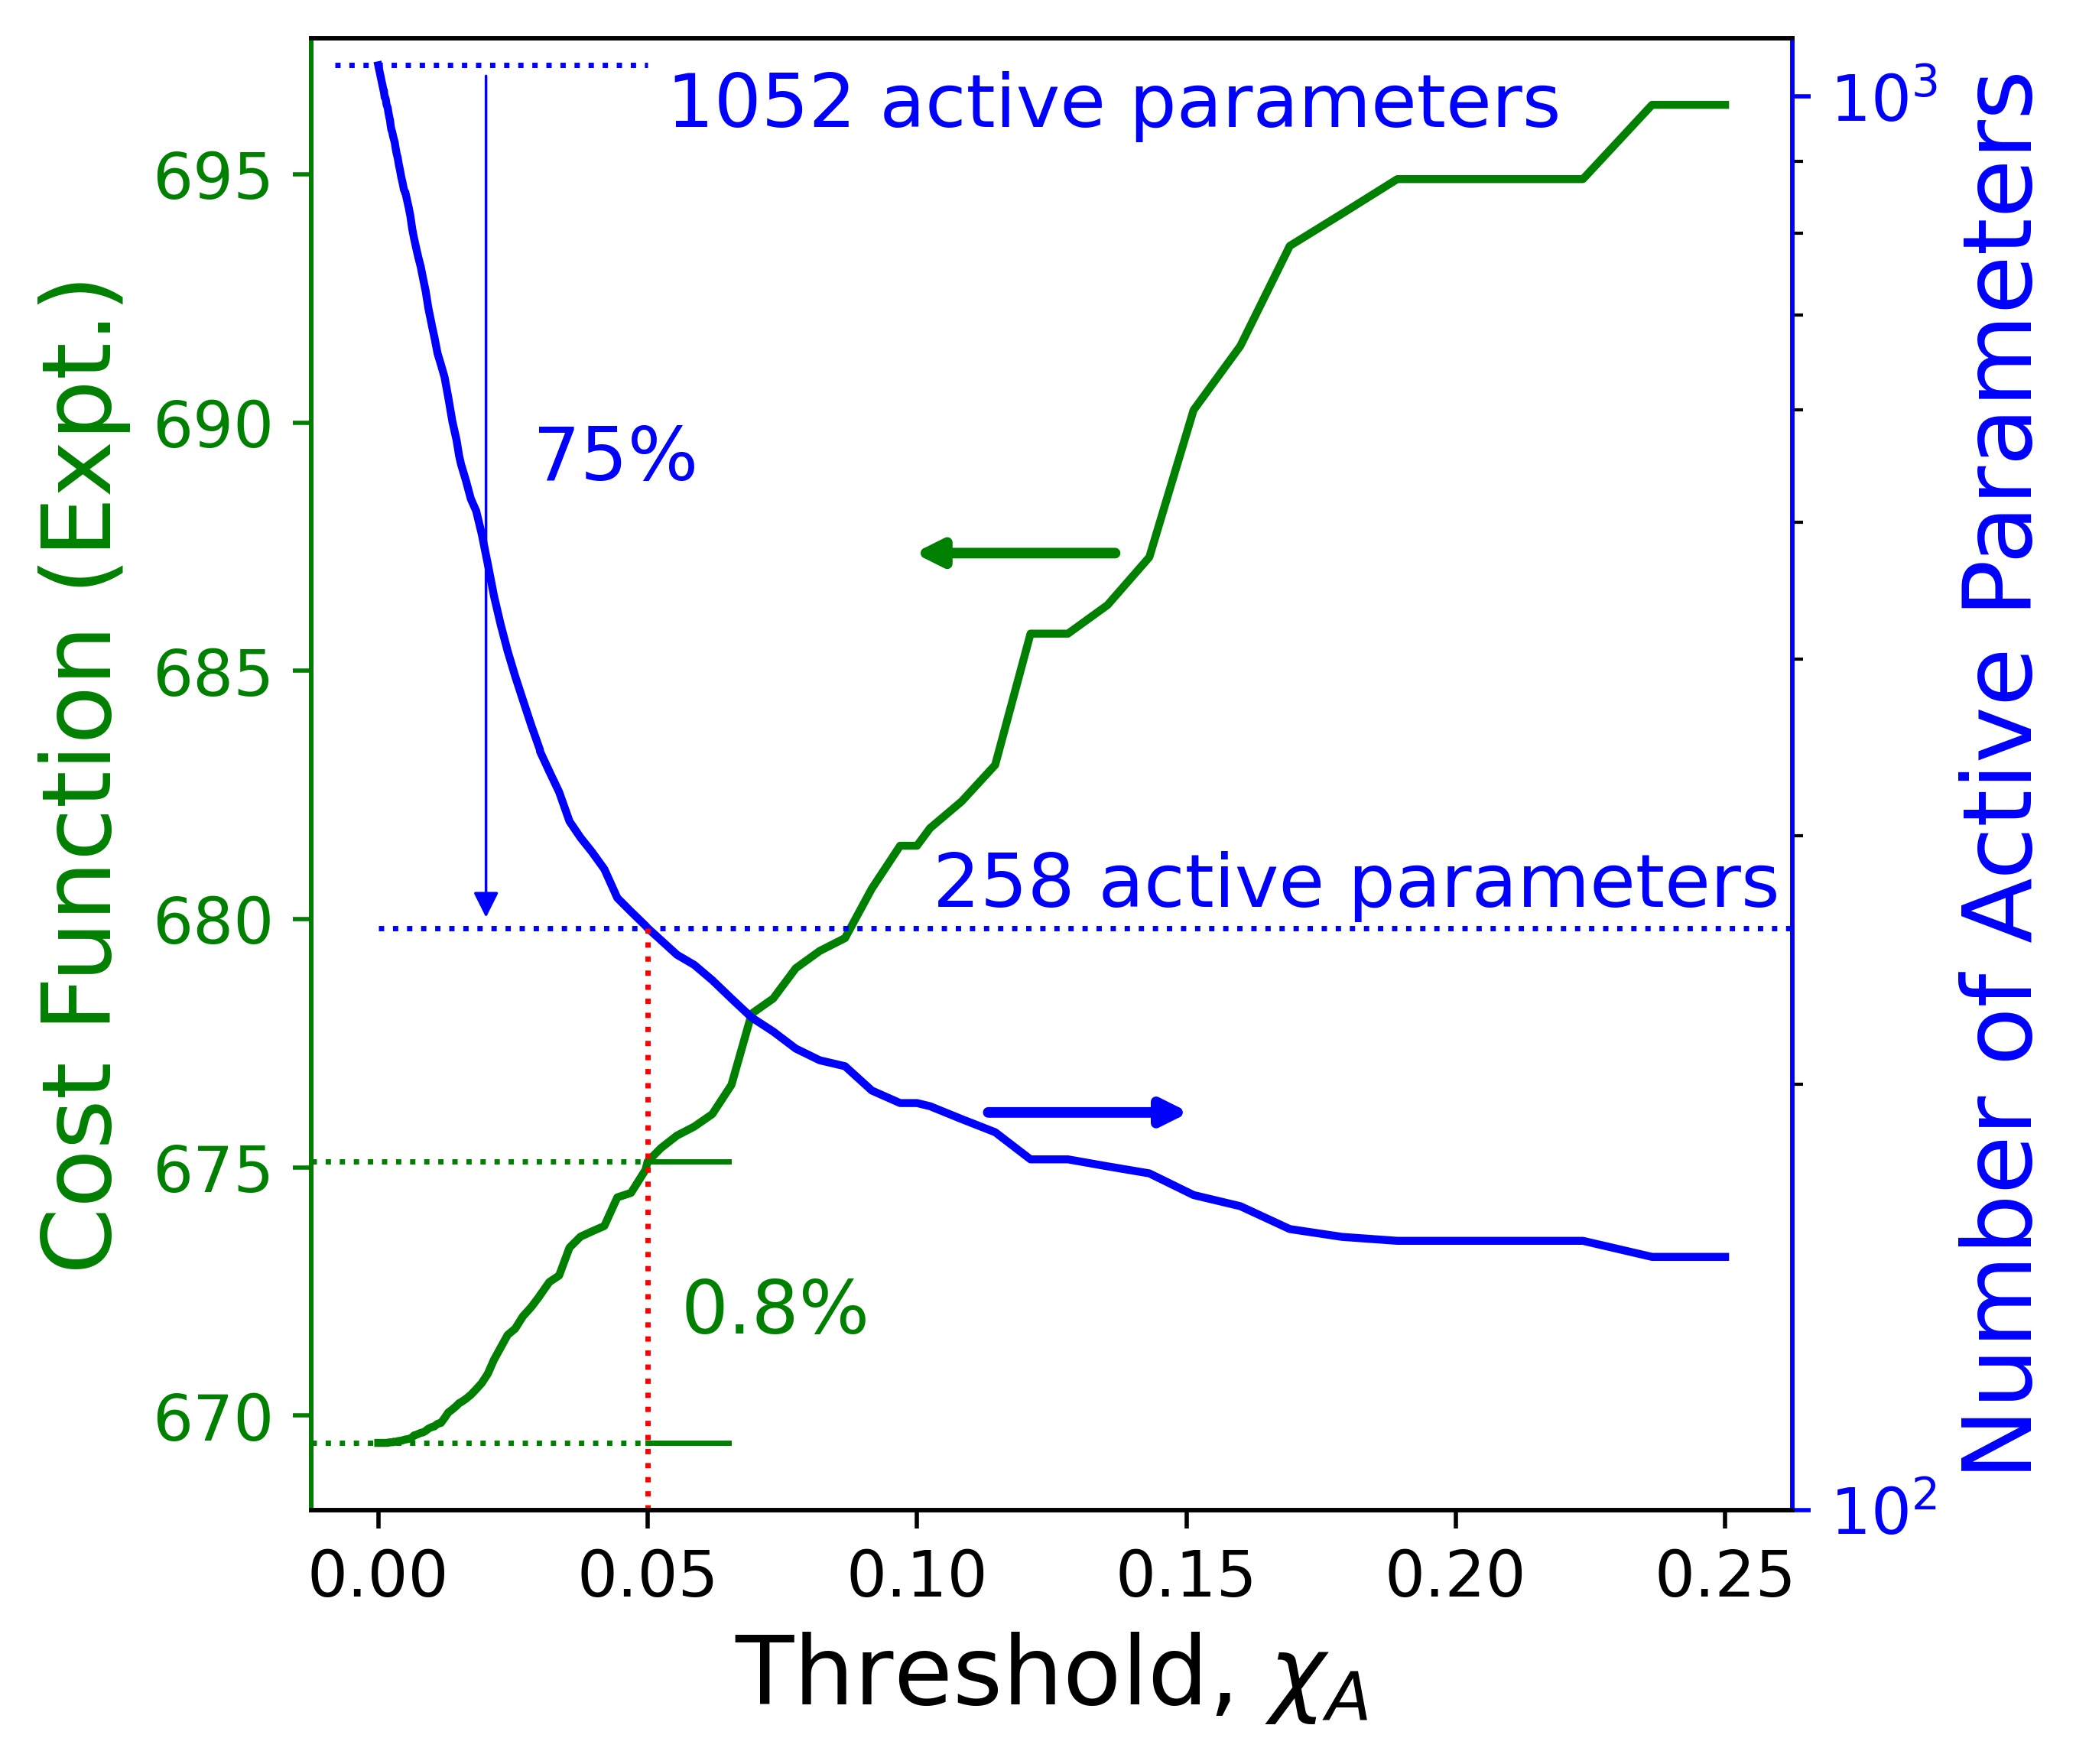
Figure 2 Parametric study of the cost function of the experiments (the first term of the objective function) and the number of active parameters as a function of the rate threshold $\chi_A$ for FFCM-2 optimization. The uncertainty threshold $\chi_{2\sigma}$ value is fixed at 0.48.
Optimized rate parameters
In the current work, the constraints on rate parameters are explicitly enforced in the optimization algorithnm to prevent the parameters from exceeding the physical limits. This ensures the physical soundness of the optimized rate constants. Figure 3 shows the histogram of the optimized $x$ values for all 258 parameters that remain active after freezing. As it can be seen, the largest absolute value of $x$ is smaller than 0.7, indicating that all of the optimized parameters lie within the uncertainty limits. In addition, 233 out of the 258 parameters have absolute values of $x$ within 0.3.
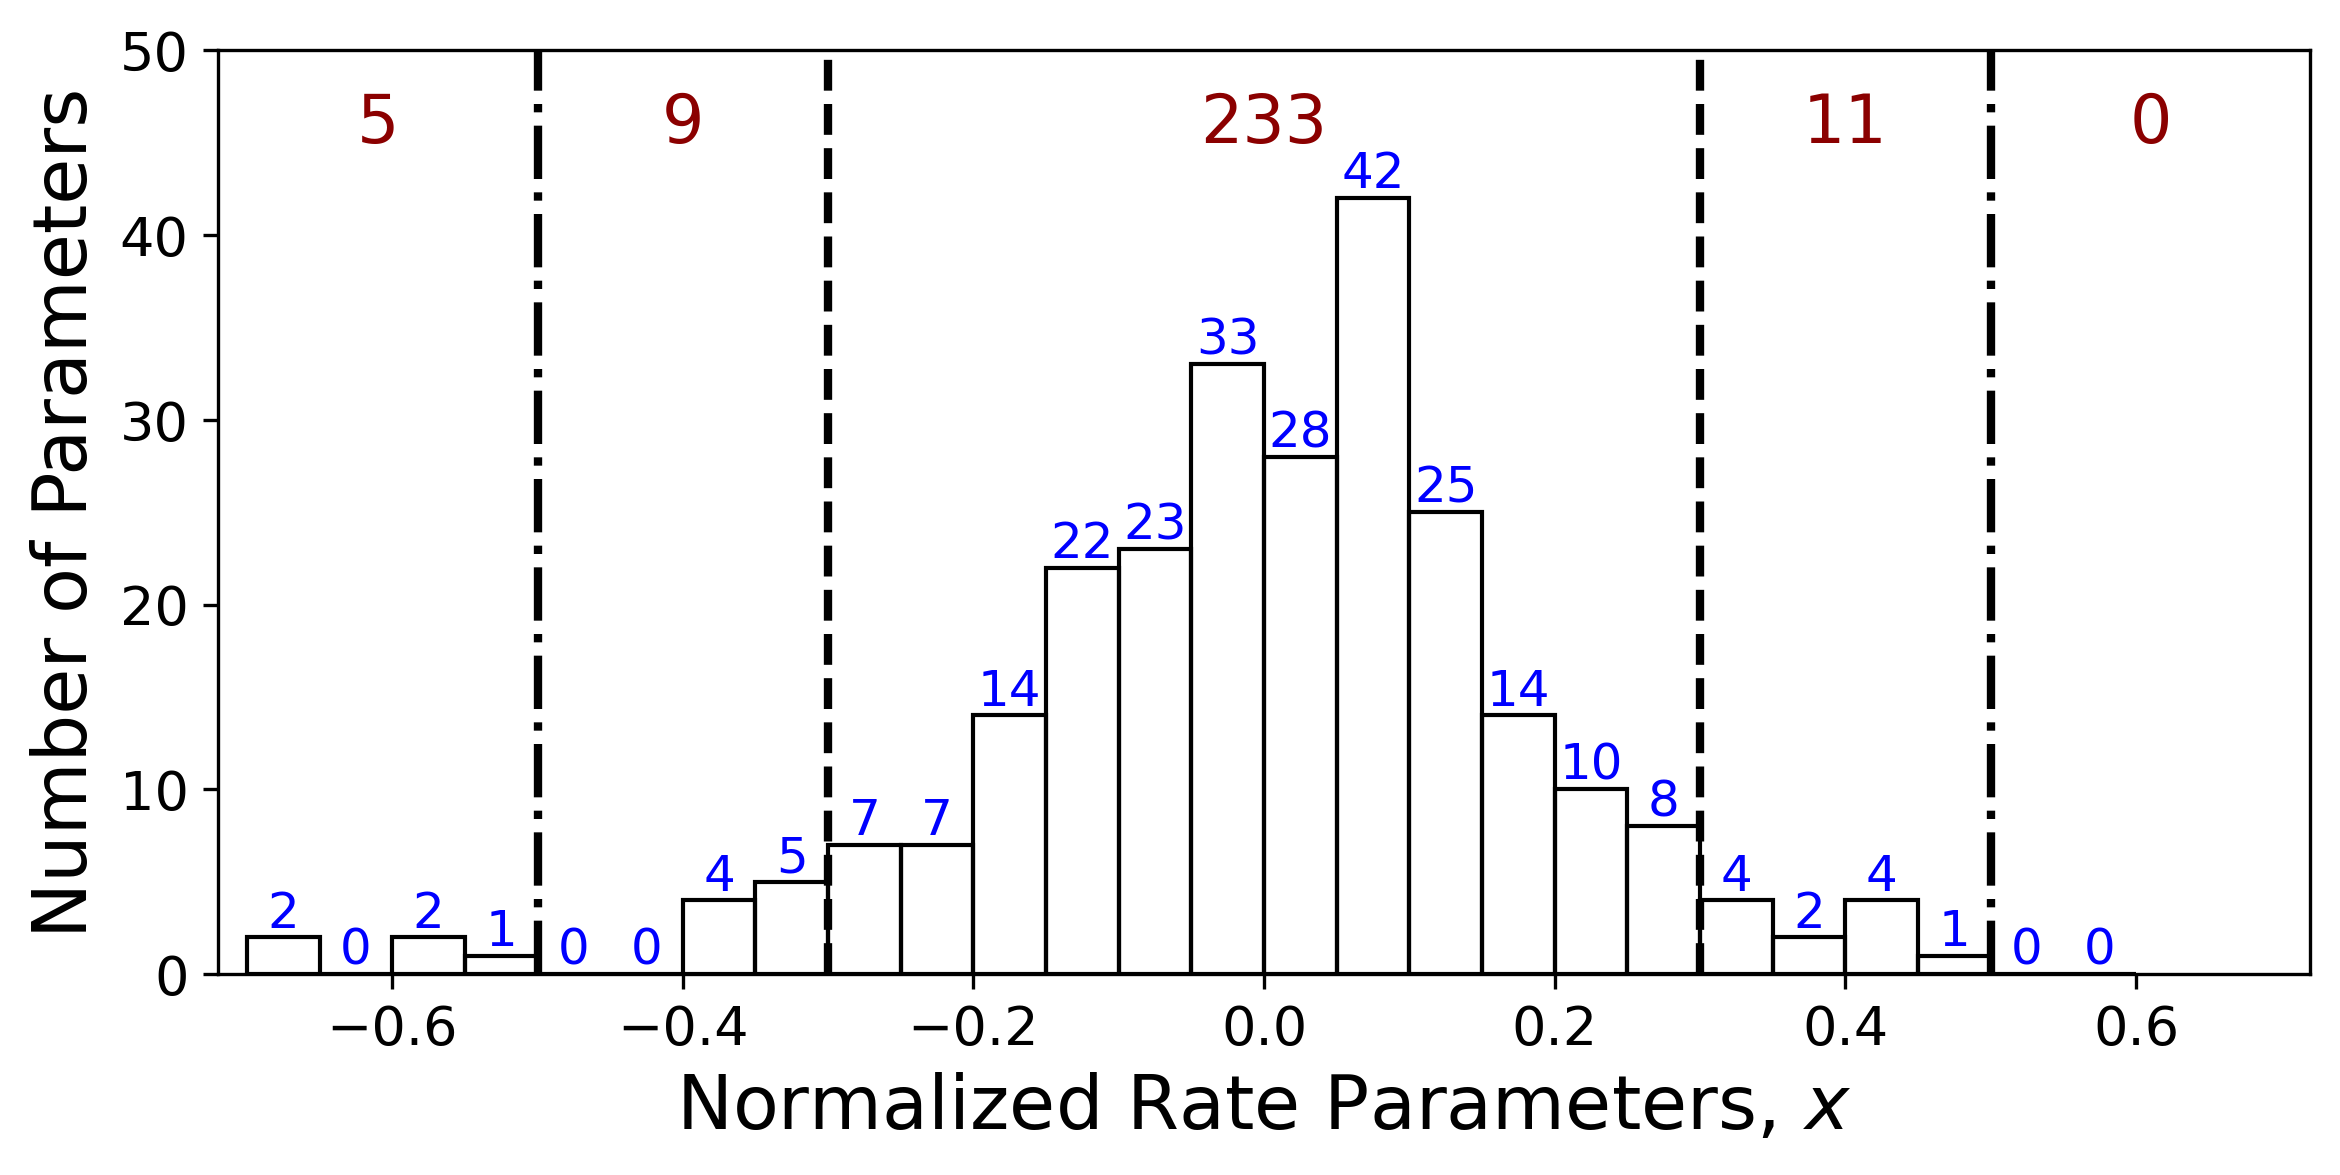
Figure 3 Histogram of the optimized $x$ values for all 258 parameters that remain active after parameter freezing. The two dashed lines represent $|x_i| \leq 0.3$ and the two dashed dot lines represent $|x_i| \leq 0.5$.
Figure 4 shows the multipliers of the optimized rate parameters $A_{i}^*/A_{i,0}$ ranked by the absolute values of $x_i$. For the trial model, all multipliers are 1 (indicated by the center dashed line). The uncertainties in the trial model (2-standard deviation) are shown as the blue horizontal error bars. The red symbols and error bars represent the nominal optimized rate constants and the optimized rate uncertainties. It is observed that the red bars are shorter than blue bars for all parameters, indicating the reduced parametric uncertainties in the optimize model. In Fig. 4, the top 25 most perturbed parameters are shown, which corresponds to $|x_i| \geq 0.3$ shown in Fig. 3. We discuss some of the perturbed reactions in the release notes.
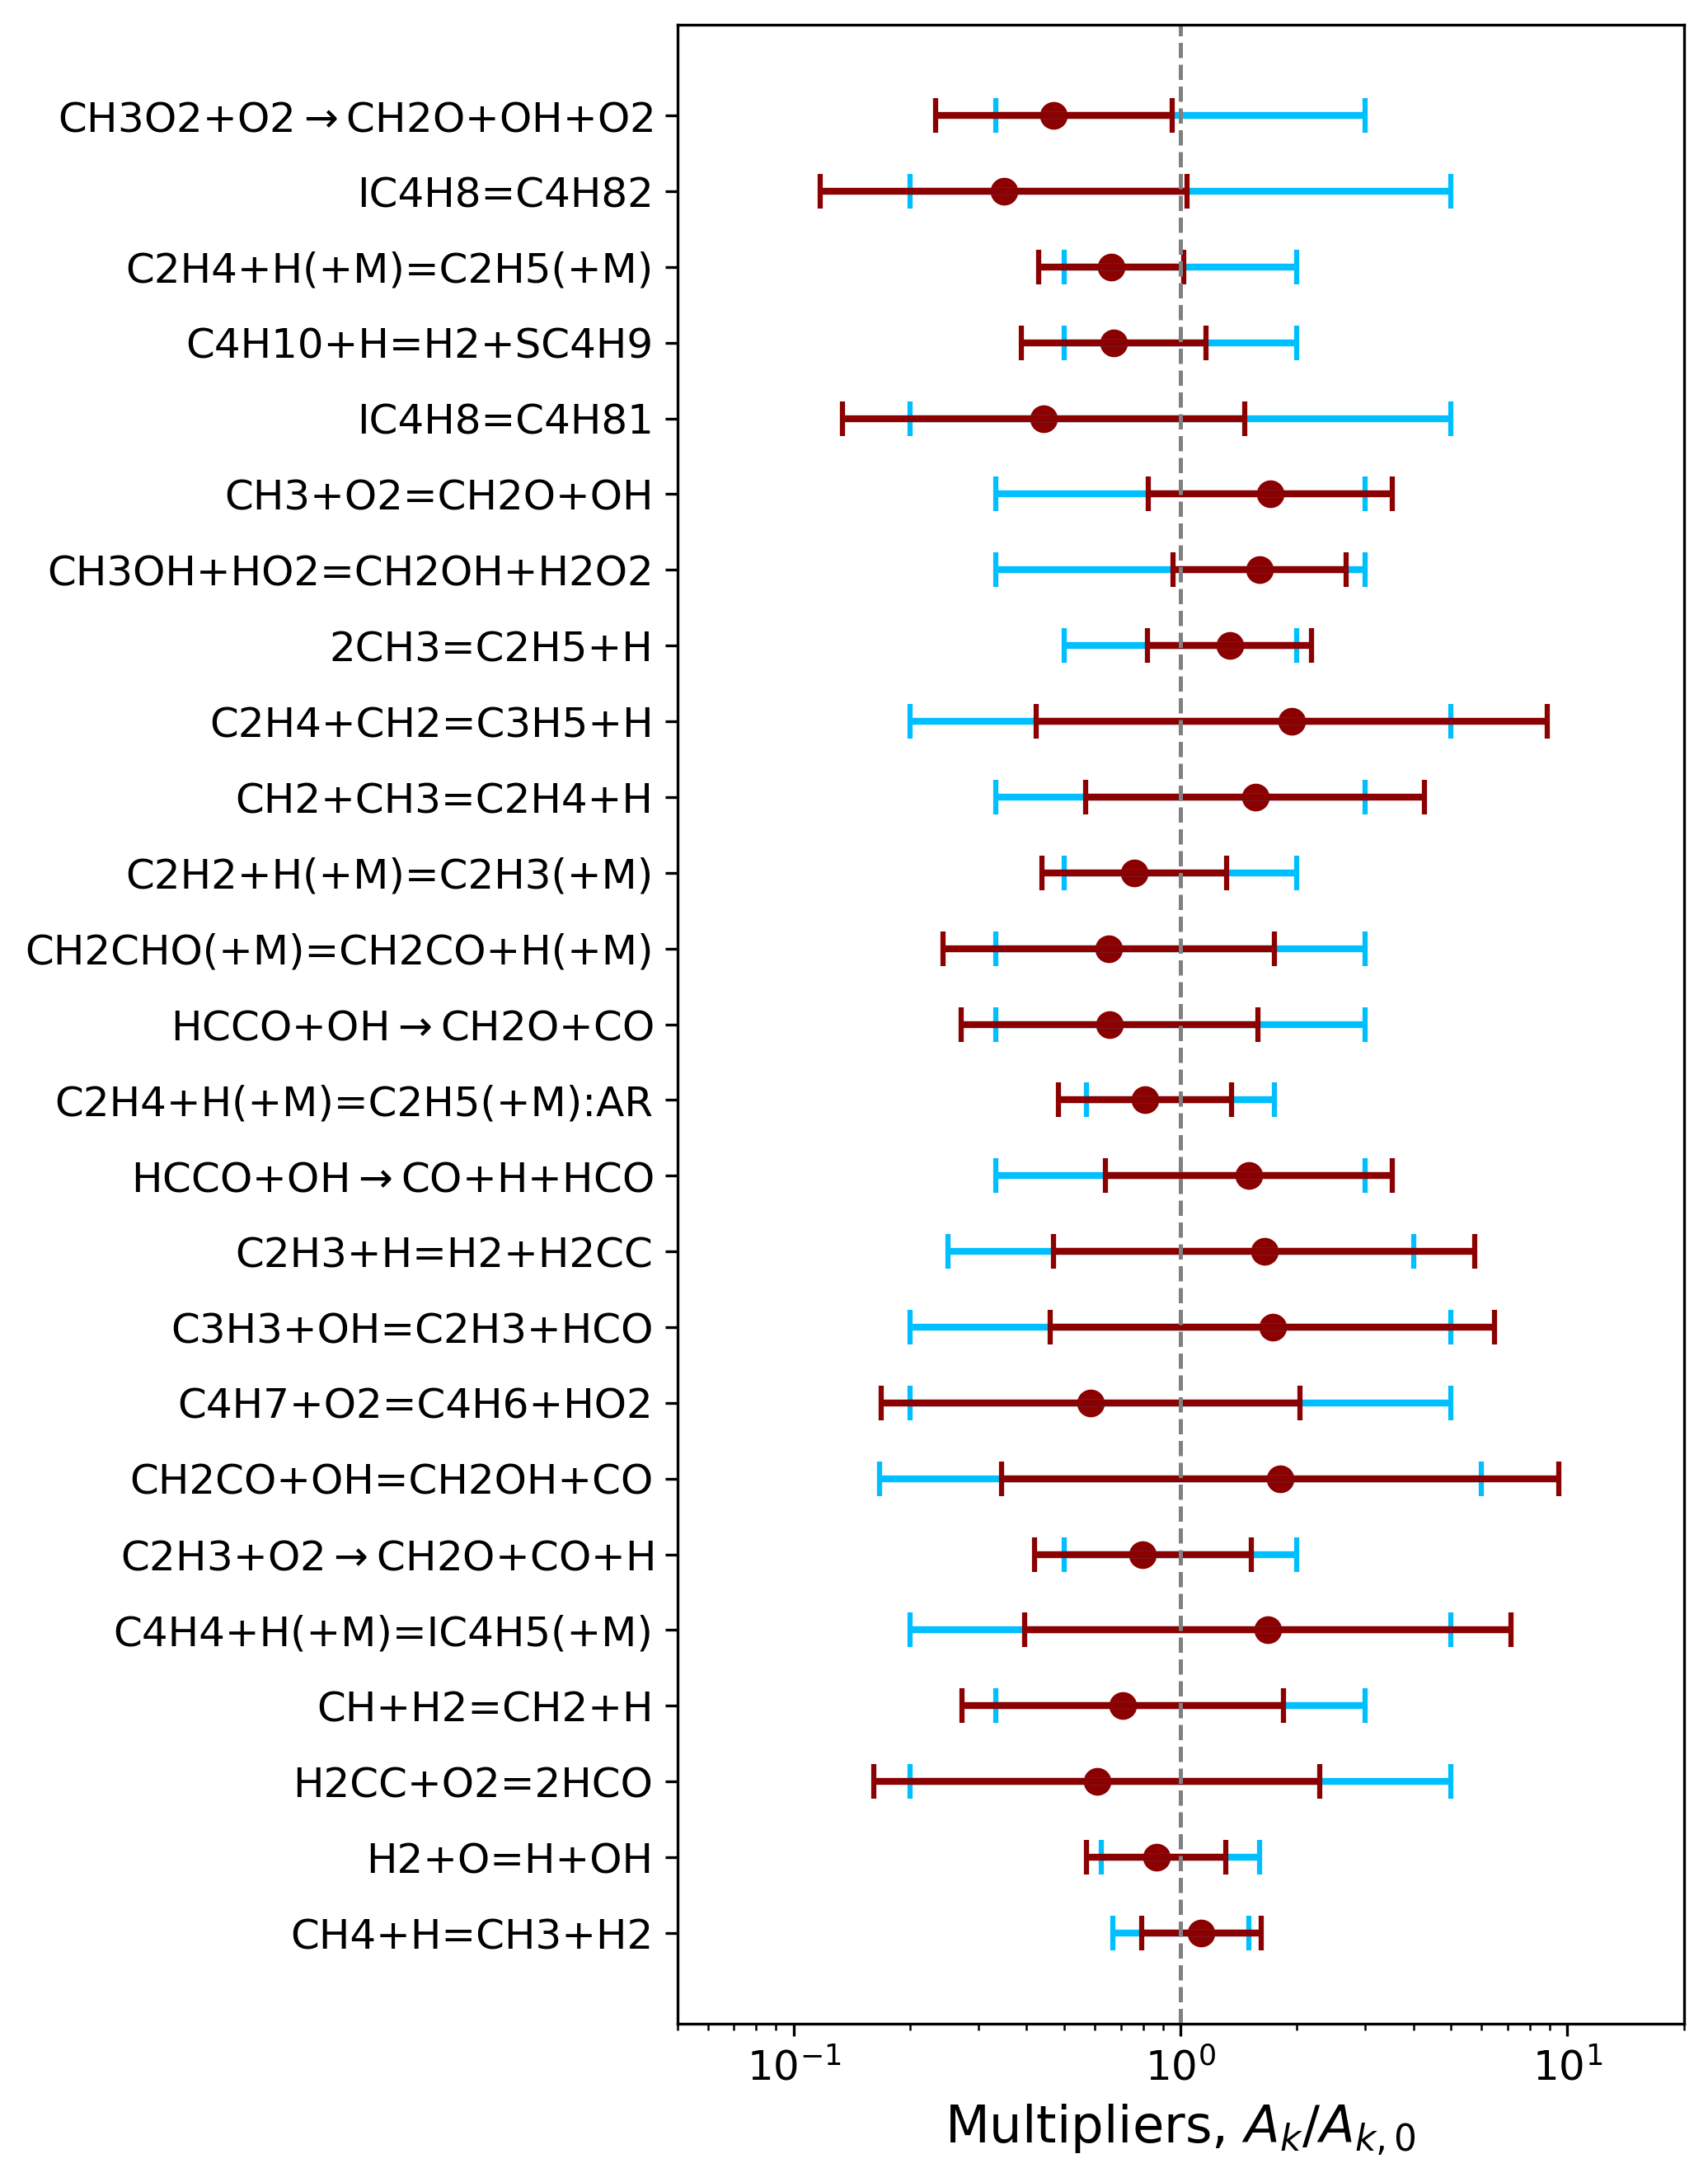
Figure 4 Comparisons of upper and lower bounds of the rate parameters before (blue) and after (red) rate parameter optimization and uncertainty minimization, shown are the top 25 most-perturbed rate parameters (ranked by the values of |x|).
Inconsistent targets
In FFCM-2 optimization, 34 out of the 1192 targets were identified as inconsistent. These targets are analyzed in detail to understand the source of inconsistency. The inconsistency may come from missing reaction pathways, inappropriate trial rate parameter assignments or uncertainties in experimental measurements. All 34 inconsistent targets and the thermodynamic conditions are listed in the Inconsistent Targets page.
Covariance matrix
The covariance matrix describes the correlation between rate parameters. In the trial model, the covariance matrix is assumed to be a diagonl matrix (trial parameters are independent). The correleation in the posterior covariance matrix reduces the parametric space of the optimized model and thus reduces the prediction uncertainties. The posterior covariance matrix can be visualized in the Covaraince Matrix page and downloaded in the Download page.