Upon typing make test, the simulation runs for a total of 3000 time steps (suntans.dat: nsteps = 3000)
with a time step of 60 s (suntans.dat: dt = 60), outputting
data every 120 time steps (suntans.dat: ntout = 120). While the data is running you can view the
results from the main source directory with
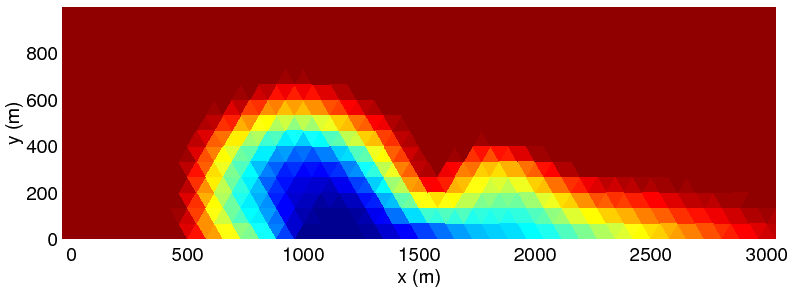
./sunplot --datadir=./examples/boundaries/dataAs can be seen from the results, the river plume forms a bulge as well as a coastal current resulting from the nonzero Coriolis parameter of
suntans.dat: Coriolis_f = 5e-4).
After 3000 time steps, the density anomaly at the upper layer is depicted in Figure 12. This
figure was obtained using the m-file sunsurf.m, which can be downloaded from
http://suntans.stanford.edu/downloads_stanford .
If you are running this m-file from the examples/boundaries directory, then the plot in Figure 12
was obtained with the command
timestep = 26;
klevel = 1;
processor = 0;
sunsurf('s','.../data',timestep,klevel,processor);
Note that sunsurf.m requires unsurf.m.