PyMOL v3.1 Notes
Back to all Computational Biology Software Notes...PyMOL is an application for molecular visualization and analysis. In this post I’ll document my own path to getting a hands-on feel for the PyMOL 3.1.8 application, which I believe will be a good representation of the underlying open source software.
Specs
Software: PyMOL v3.1.8
Hardware: Apple M2 SOC (Macbook Pro)
Loading Molecule
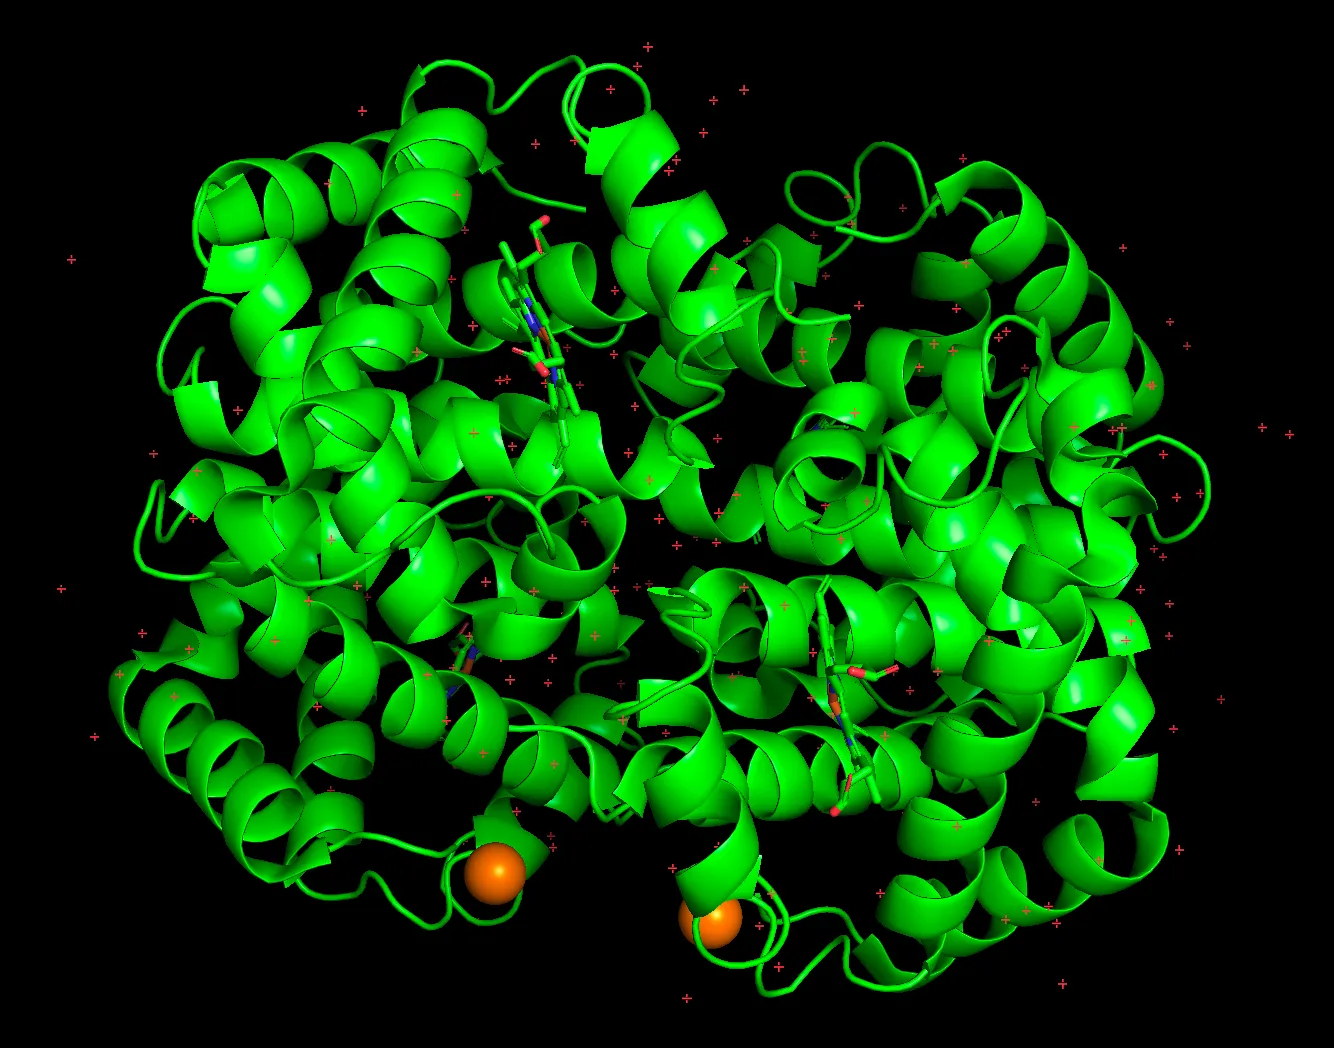
For the sake of getting a basic understanding, I loaded a simple molecule with a PDB ID recommended to me by ChatGPT:
fetch 4hhbGenerally, loading can be done with any PDB or mmCIF file containing structure data.
Rough Molecular Hierarchy: Chains, Residues, and Ligands
Having arbtrary atoms in space is one way to visualize structure, but organizational structure gives us a far better way to visually comprehend molecular structures. Here’s a nice hierarchy diagram ChatGPT gave me:
PDB ENTRY
   │
   ├── molecular entities
   │      │
   │      └── chain instances
   │              │
   │           residues
   │              │
   │            atoms
   │
   └── other structural/experimental information
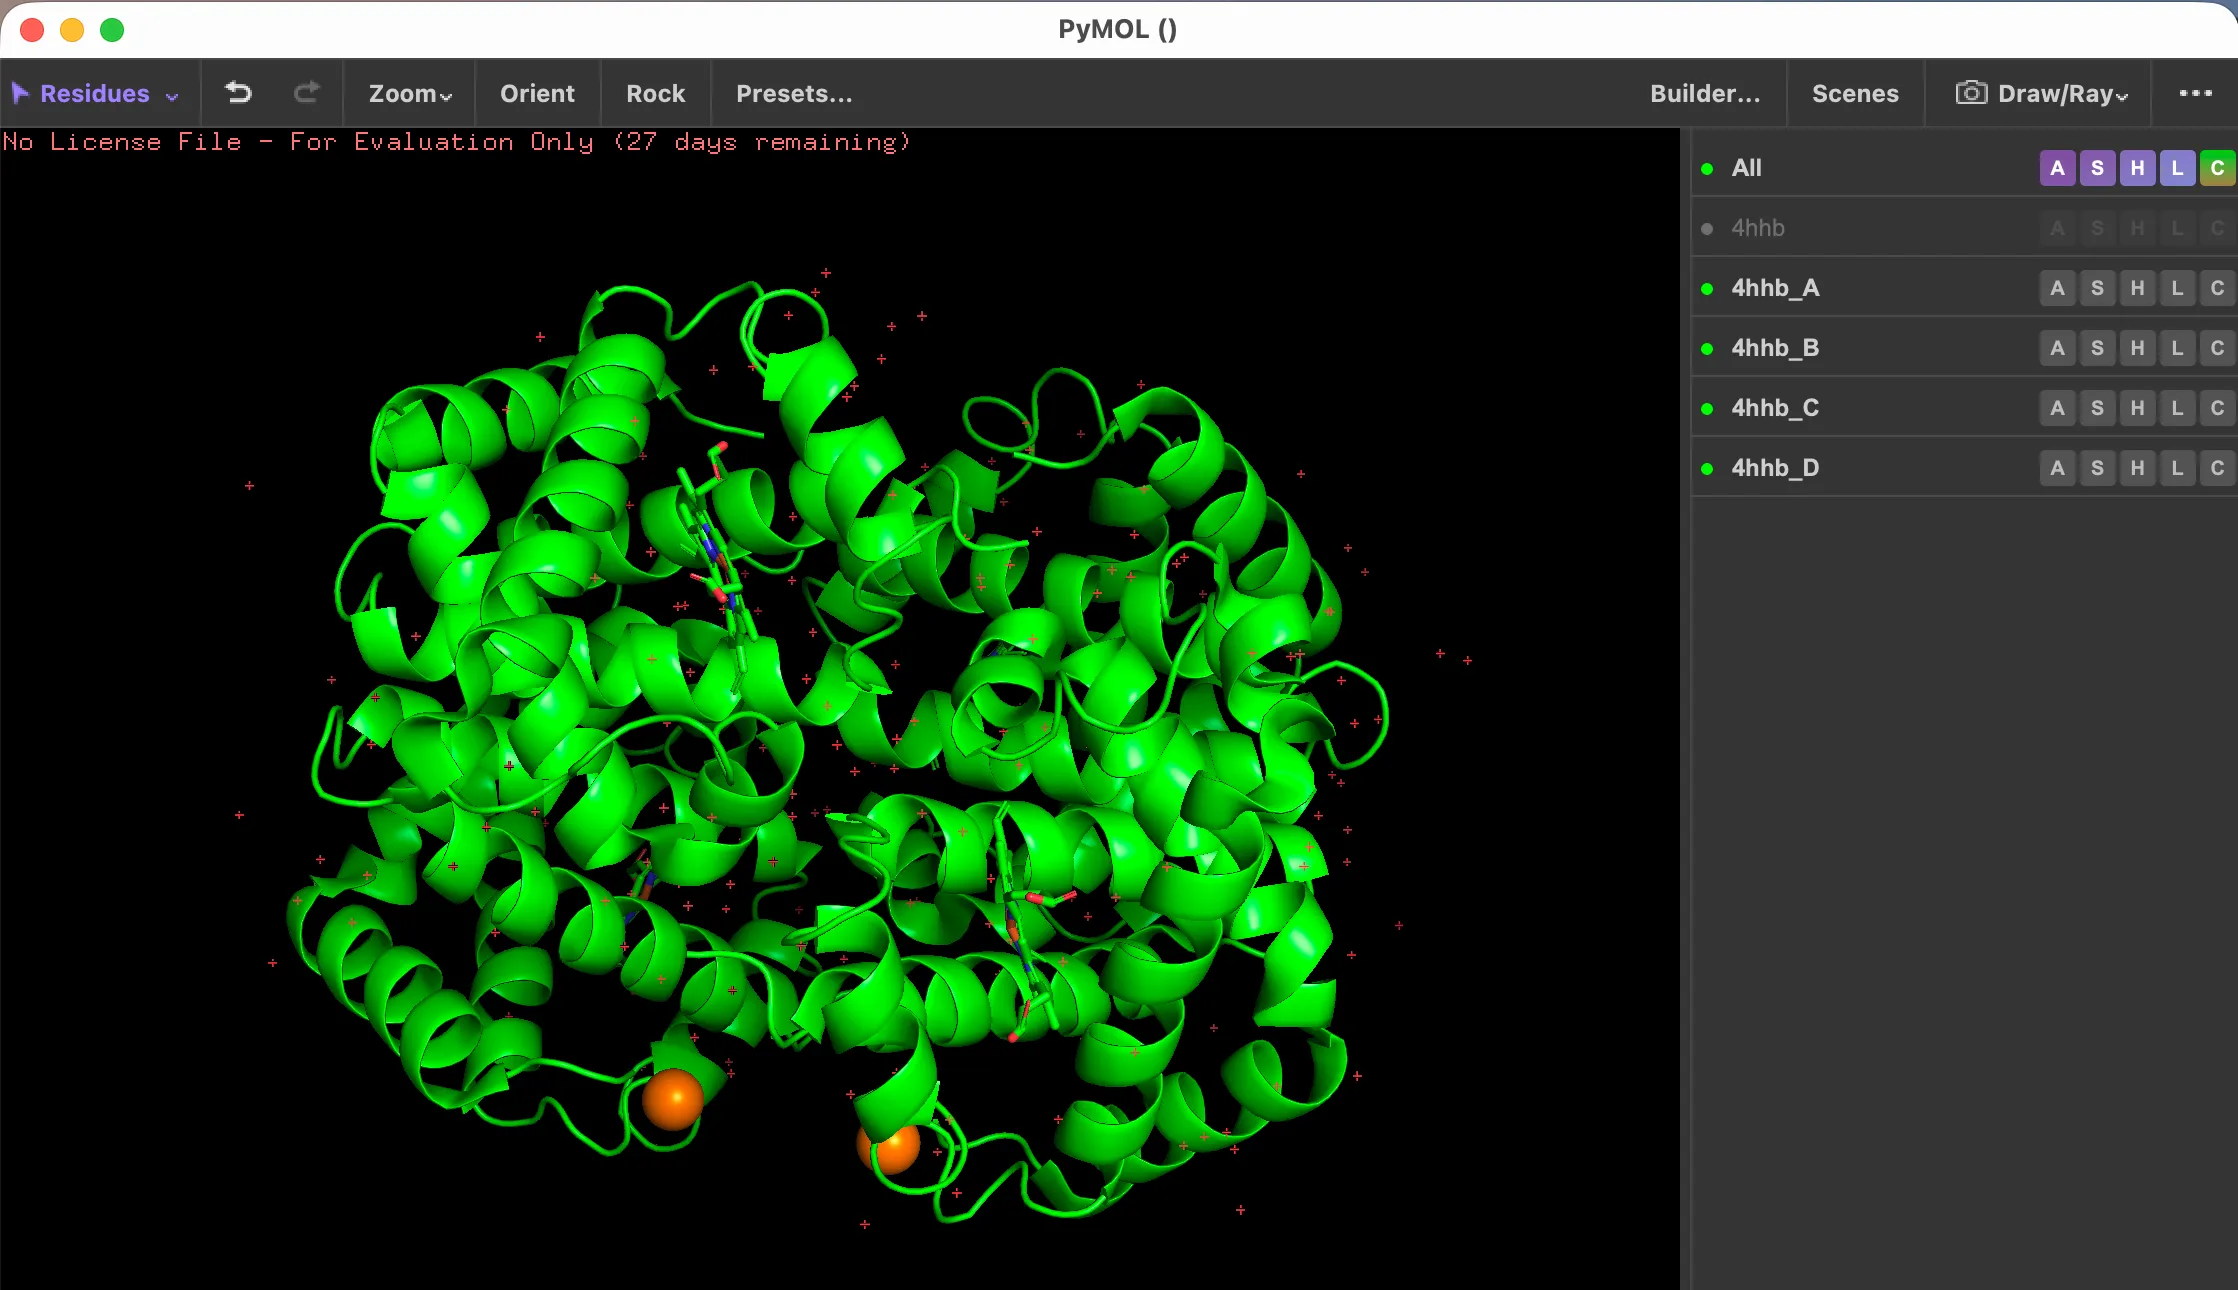
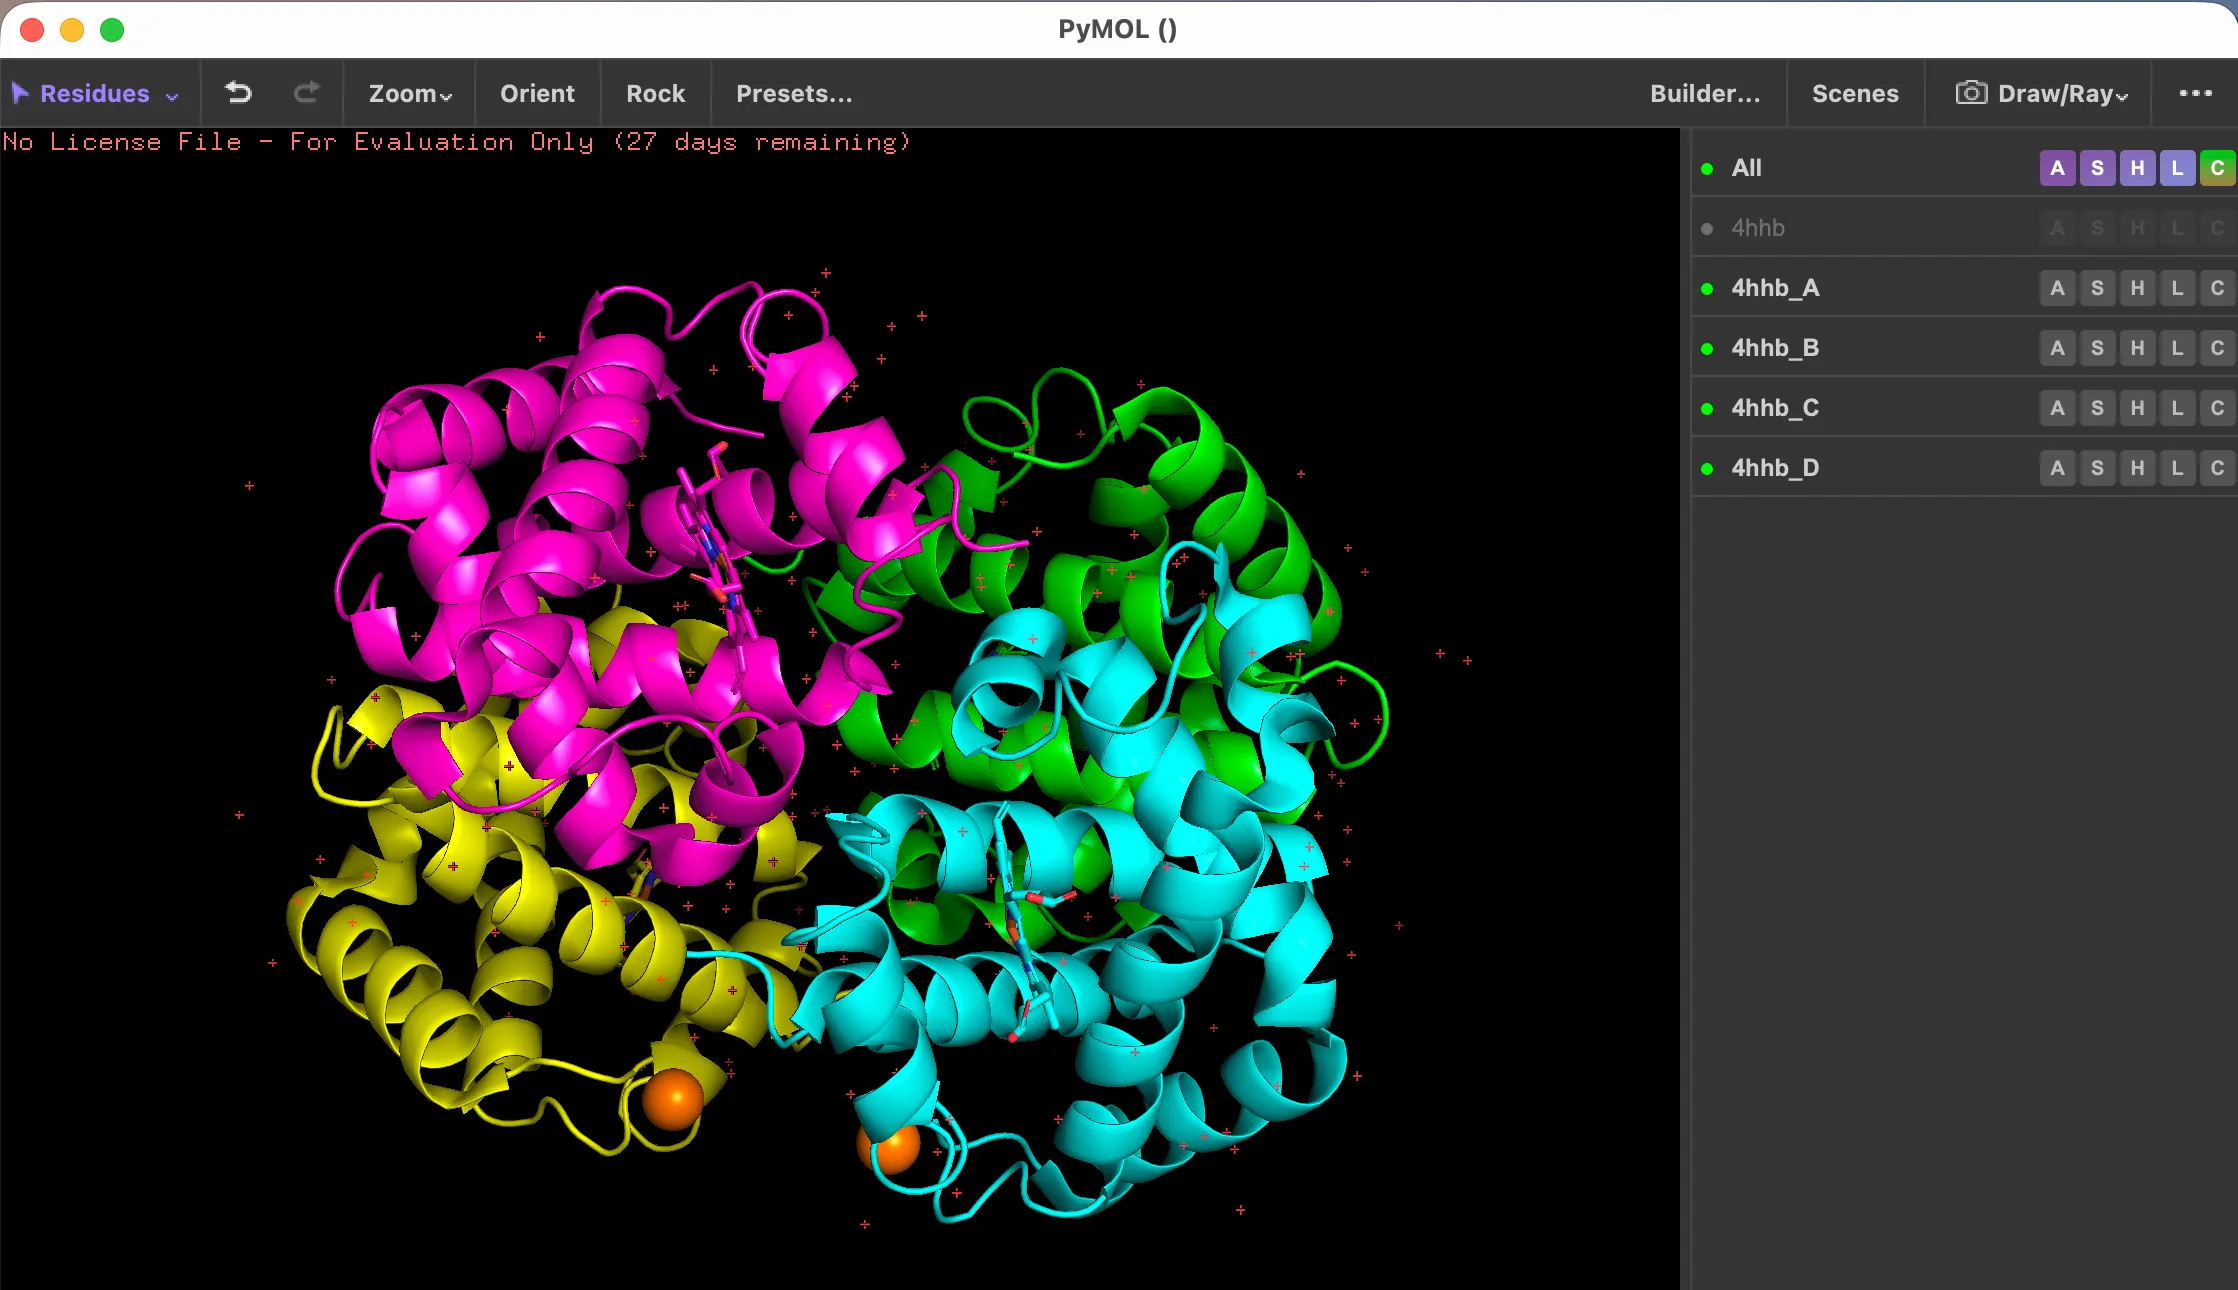
Structure files often contain grouping information on top of just atom positions, as mentioned above, like residues, chains (e.g. in the case of polymers), ligands, etc.. PyMOL commands and UI help us navigate this. First, the sidebar contains five boxes: A, S, H, L, and C, the last of which is “color”. Clicking it allows us to color by chains, atoms, or other groupings.
We can also use the following command:
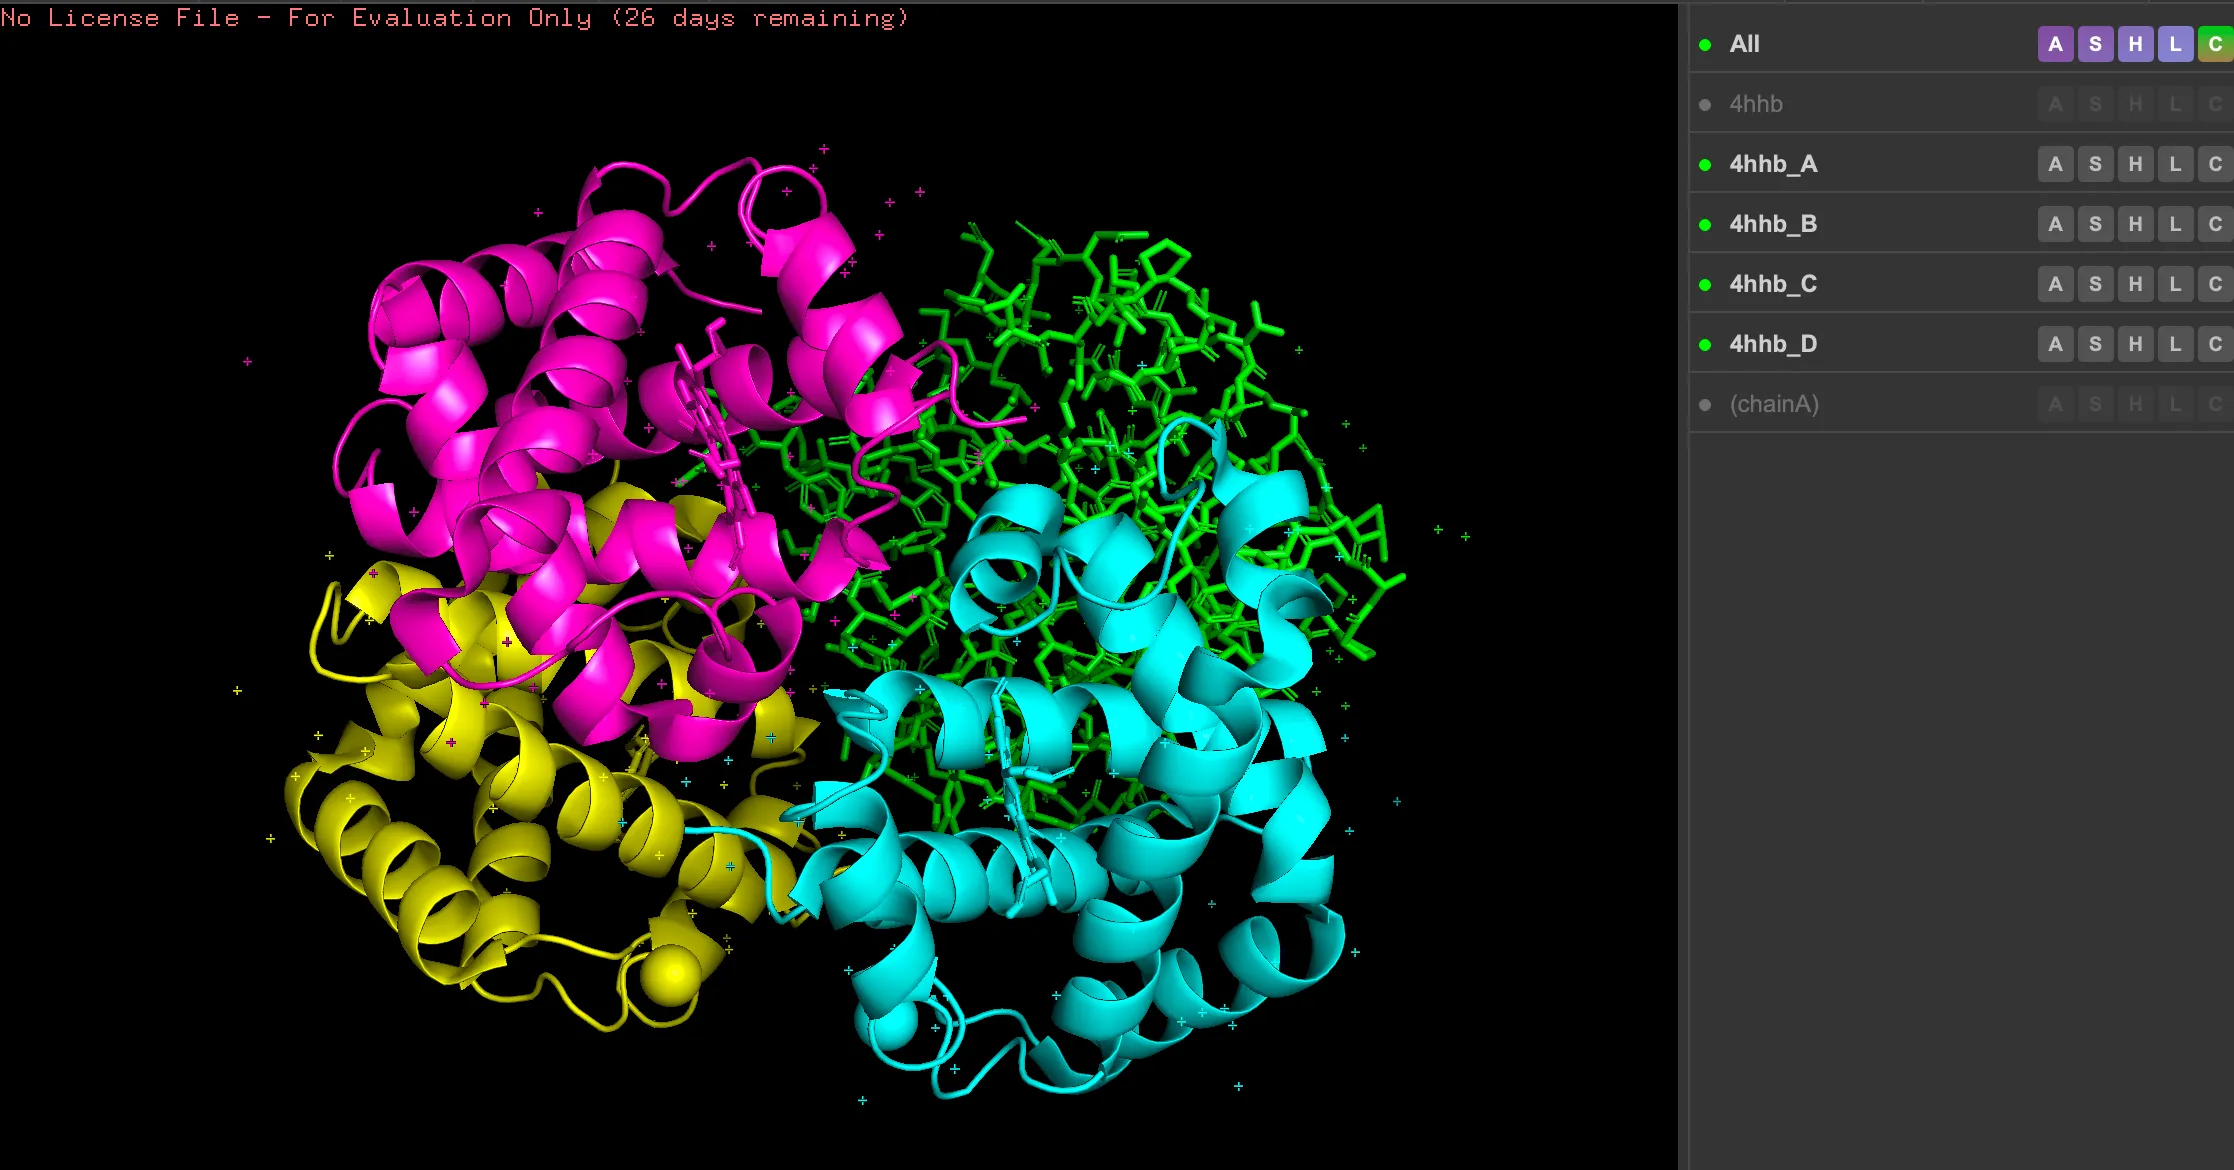
split_chainsto split our visualization by chains (we can now see the chains in the side bar). Similarly, commands exist for selecting specific residues, atoms, ligands, and more based on their identification numbers or symbols.
After coloring:
Selection
Selection is the process of defining a collection of atoms within the structure and giving it a label, so that it can be visually manipulated independently of the other parts of the visualization.
For example, the split_chains gave us four new labels to work with. An alternate way to select just the first chain “A”, and give it the label “chainA” would have been:
select chainA, chain AAnother option is to simply select using the mouse, or via other keywords.
Switching Visual Representations
A selection can be rendered with any combination of several representations:
  angles      cgo         ellipsoids  licorice    nonbonded   sticks
  callback    dashes      everything  lines       ribbon      surface
  cartoon     dihedrals   extent      mesh        slice       volume
  cell        dots        labels      nb_spheres  spheres     wire
For example, try the command:
show sticks, chainA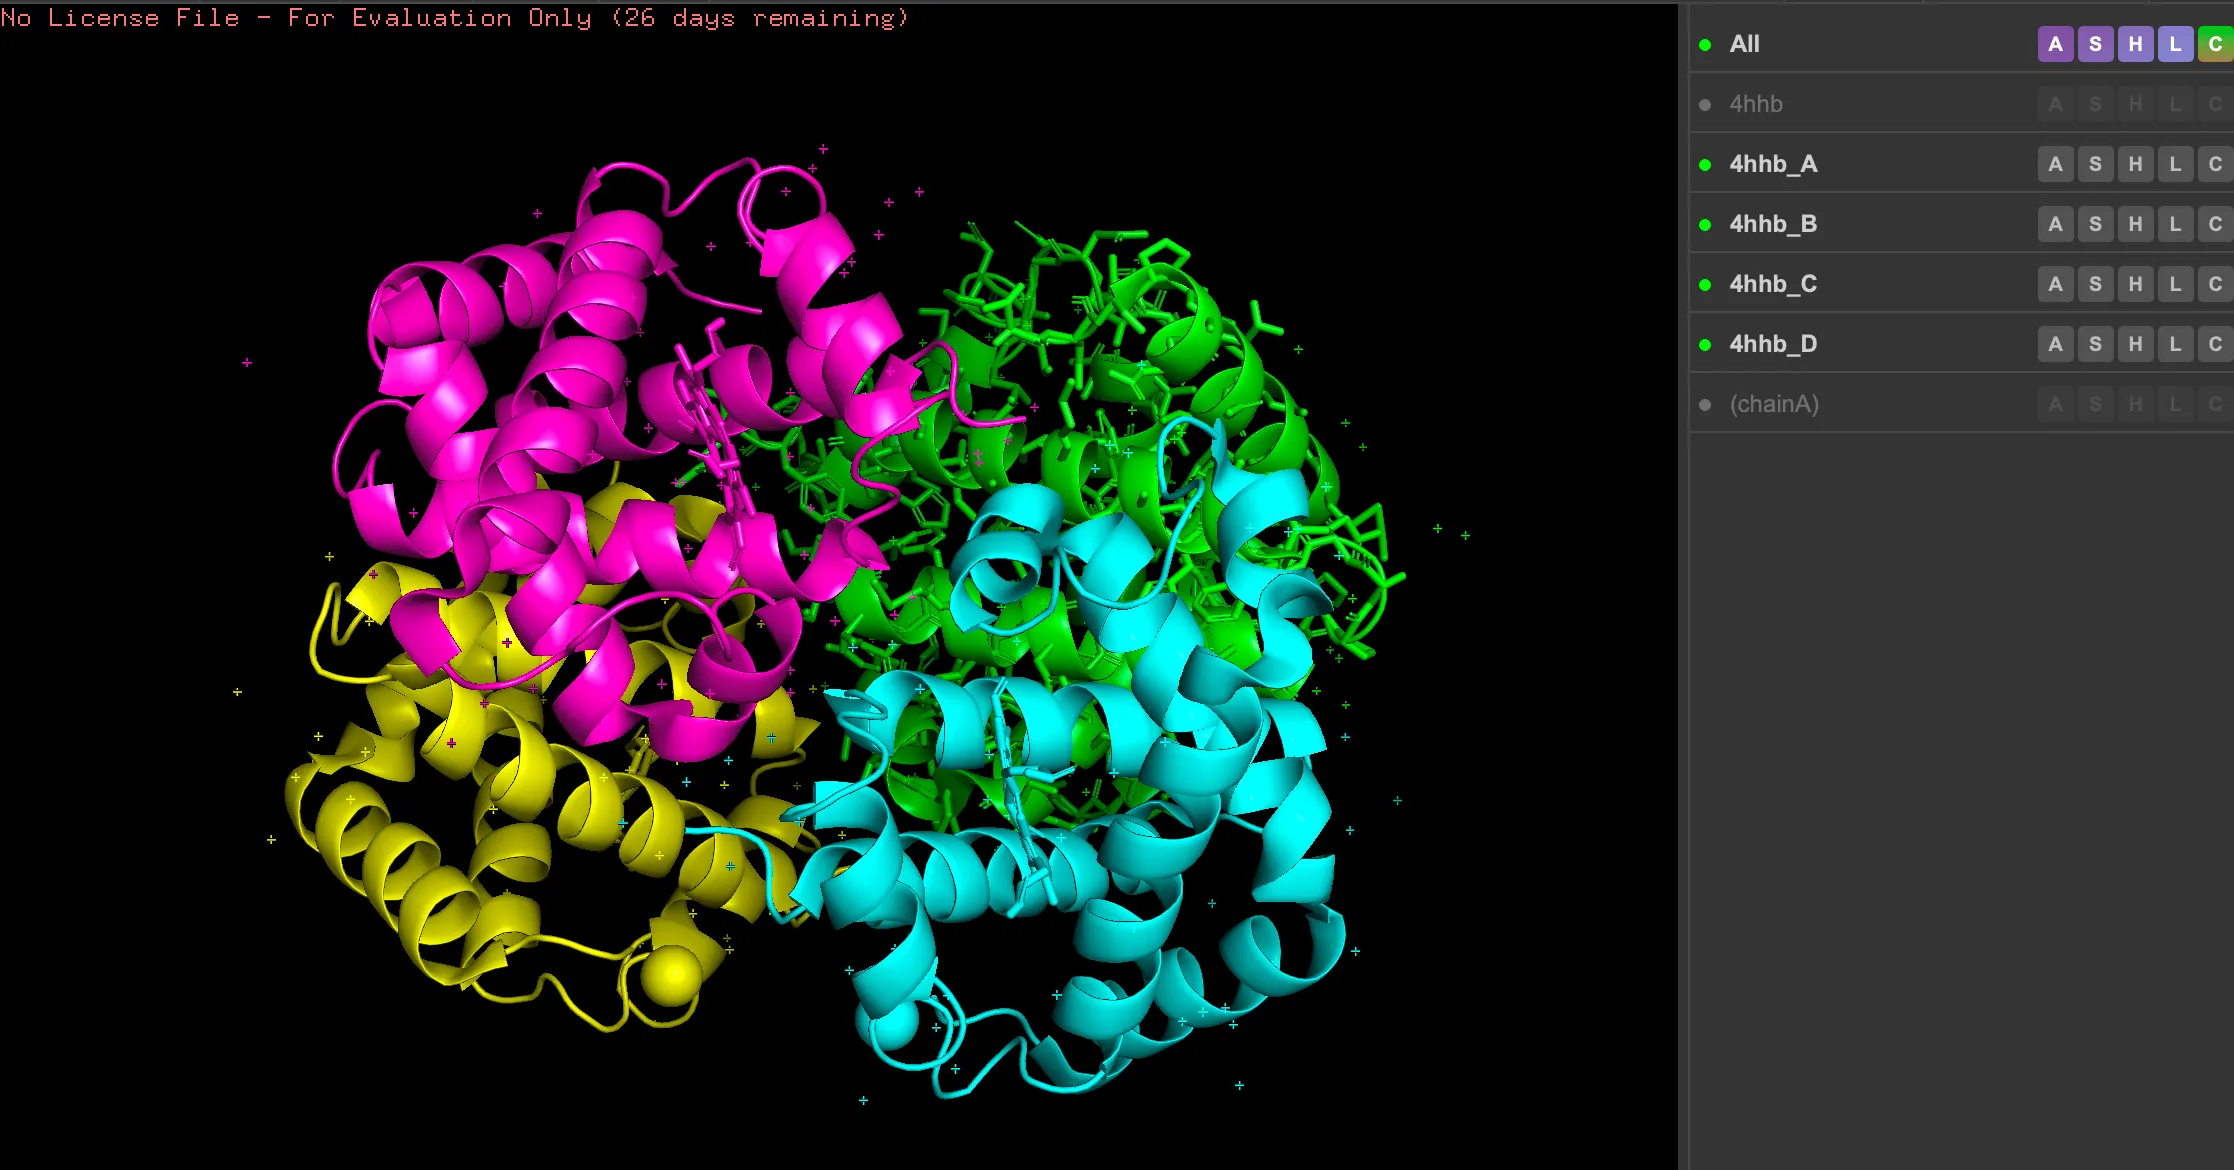
Similarly, one can hide a representation:
hide cartoon, chainA