Contents
Generate problem data
randn('seed', 0);
rand('seed',0);
m = 1500;
n = 5000;
p = 100/n;
x = sprandn(n,1,p);
A = randn(m,n);
A = A*spdiags(1./sqrt(sum(A.^2))', 0, n, n);
b = A*x + sqrt(0.001)*randn(m,1);
xtrue = x;
Solve problem
[x history] = regressor_sel(A, b, p*n, 1.0);
iter	    r norm	   eps pri	    s norm	  eps dual	 objective
  1	    3.1818	    0.0465	    2.3330	    0.0389	      5.38
  2	    1.1927	    0.0585	    2.6814	    0.0487	      7.92
  3	    1.1216	    0.0790	    2.2545	    0.0485	      6.72
  4	    1.2543	    0.0934	    1.7125	    0.0446	      4.94
  5	    1.3137	    0.1020	    1.4387	    0.0400	      3.57
  6	    1.2244	    0.1070	    1.1351	    0.0349	      2.49
  7	    1.0563	    0.1093	    0.8049	    0.0304	      1.77
  8	    0.8269	    0.1095	    0.4945	    0.0276	      1.40
  9	    0.5639	    0.1085	    0.2625	    0.0265	      1.29
 10	    0.3841	    0.1069	    0.2960	    0.0263	      1.28
 11	    0.3259	    0.1054	    0.3102	    0.0264	      1.28
 12	    0.2956	    0.1041	    0.2813	    0.0263	      1.26
 13	    0.3156	    0.1032	    0.2956	    0.0263	      1.25
 14	    0.2677	    0.1027	    0.1912	    0.0263	      1.23
 15	    0.2134	    0.1025	    0.1609	    0.0263	      1.24
 16	    0.1605	    0.1025	    0.0817	    0.0264	      1.24
 17	    0.1059	    0.1025	    0.0578	    0.0266	      1.25
 18	    0.1503	    0.1025	    0.1397	    0.0267	      1.26
 19	    0.1164	    0.1026	    0.0708	    0.0268	      1.27
 20	    0.0712	    0.1026	    0.0459	    0.0269	      1.28
 21	    0.0557	    0.1026	    0.0319	    0.0270	      1.29
 22	    0.0425	    0.1026	    0.0253	    0.0271	      1.30
Elapsed time is 2.188126 seconds.
Reporting
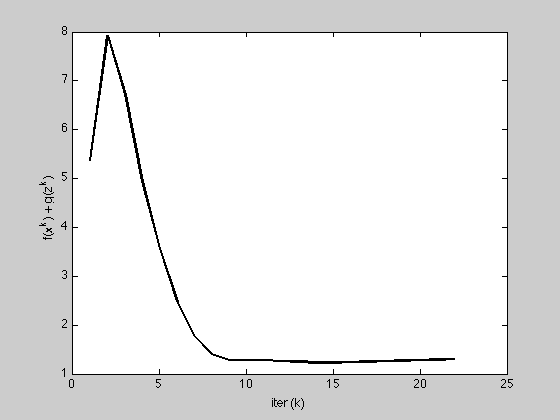
K = length(history.objval);

h = figure;
plot(1:K, history.objval, 'k', 'MarkerSize', 10, 'LineWidth', 2);
ylabel('f(x^k) + g(z^k)'); xlabel('iter (k)');

g = figure;
subplot(2,1,1);
semilogy(1:K, max(1e-8, history.r_norm), 'k', ...
    1:K, history.eps_pri, 'k--',  'LineWidth', 2);
ylabel('||r||_2');

subplot(2,1,2);
semilogy(1:K, max(1e-8, history.s_norm), 'k', ...
    1:K, history.eps_dual, 'k--', 'LineWidth', 2);
ylabel('||s||_2'); xlabel('iter (k)');


Compare to l1 regularization

