Card Clubs and Crime In California
Thomas Gale Moore
Senior Fellow
Hoover Institution
Stanford University
With the growth of legal gambling in many states and on native American reservations, the public has begun to debate the relationship of such activity to crime. Many fear that the development of legalized gaming will bring in its wake mobsters, racketeering, robberies, drugs, and other illegal or offensive activity. A few studies (Hakim and Buck 1989; Chiricos 1994) have examined the relationship. Chiricos concludes that crime, after adjusting for the size of the population, does not contribute to crime. On the other hand, Hakim and Buck find greater crime in areas close to the legal gambling in Atlantic City. This study examines one state, California, where some communities permit a form of gambling, card clubs, and others do not. The results show that crime is unrelated to legalized gaming.
This study first describes the likely effects of licensed card clubs on illegal activity. The empirical section, which follows, contains a statistical analysis of crime in California cities and its relationship to legal card clubs, the number of licensed tables, and the size of the establishment. In addition,the author secured data on crime in various parts of the City of San José to provide a comparison of illegal activity in those areas with that at city-approved card clubs.
The analysis of a relationship between card clubs and crime indicates that it is implausible that legal card clubs, which are substitutes for illegal ones, would attract crime. Illegal gambling, on the other hand, is likely to foster other activity which is against the law. In addition, the data from cities that license clubs and those that do not, as well as an examination of the location of crime within San José, show no relationship between card club activity and crime.
The City of San José gains from the existence of the clubs. For the last six months of 1996, the two licensed clubs contributed $4.2 million to the city’s treasury. In total, card clubs add about $8.5 million annually to San José’s receipts. Moreover, Bay 101 employs 800 workers, who also add to the city’s revenues. With only fifteen reported major crimes for all of 1995, the latest year for which data are available, the benefits to the city of the clubs greatly outweigh any additional police costs.
Previous Research
Most of the evidence supporting allegations that legal games foster crime has been anecdotal. For example, the Chief of Police of San Jose, Louis A. Cobarruviaz, has pointed to thefts of high tech equipment, loan sharking, auto theft, credit card fraud, extortion, drug transactions, fencing, and follow-home robberies. It has never been shown that card clubs caused any of these activities. With the possible exception of loan sharking and follow-home robberies, all might have taken place without legal card clubs. The two exceptions reflect crime related to gambling.
Although gambling is illegal in most jurisdictions, it continues to flourish. Thus a big winner in an illegal game in San Francisco can as easily be "followed home" as a winner from a legal game in San Jose. An unlucky player in an illegal game can succumb as easily to the attraction of a quick loan at exorbitant rates as one in a licensed game room. Do card clubs cause more crime than would exist in their absence? That question the Police Chief has failed to answer.
A number of academic researchers have found that legal gambling does not foster crime. Ted Chiricos, professor of the School of Criminology and Criminal Justice at Florida State University, who studied casinos and crime, concluded that:
Available evidence does not support a conclusion that casinos cause crime. When population is adjusted for tourists and other visitors, crime rates in Atlantic City, Las Vegas and Reno are lower than the major tourist cities in Florida. (Unpublished report, "Casinos and Crime: An Assessment of the Evidence," October 1994, p. 1.)
In examining reported crimes, Professor Chiricos adjusted not only for the resident population, as many researchers had done previously, but for the total population, including visitors. With this adjustment for visitors, he found no relationship between crime and either the existence or the introduction of casinos.
On the other hand, in a report to the Oxnard City Council, District Attorney Michael D. Bradbury warned against licensing card clubs. The report quotes San Diego County District Attorney, Edwin L. Miller, Jr.:
Some cities, including the City of Commerce in Los Angeles County, have found that licensing large scale cardroom casinos has been an extremely profitable enterprise for the city. However, in our view these monetary rewards have come at the expense of public safety and have opened the doors of these cities to organized crime, prostitution, loan sharking, money laundering, extortion, and robbery. (Unpublished report, "A Public Report to the Oxnard City Council, ‘Cardroom Casinos: the Promise and the Reality,’" June 22, 1993, p. 7).
Based on interviews, unsubstantiated allegations, and anecdotal evidence, Miller’s report made no attempt to measure crime and its relationship to card clubs by objective standards. District Attorney Bradbury simply listed investigations, reports of corruption, allegations of the involvement of unsavory individuals, and examples of police arrests around or in card clubs. He also claimed that organized crime groups based in the Asian community were utilizing card clubs for "a wide array of criminal activity." Mr. Bradbury emphasized that many of the players were "hopelessly addicted" to gambling, without specifying any evidence to that effect or the proportion of players supposedly "hooked" on playing.
Reviewing the evidence on crime and card clubs, Douglas Krathwohl, Chief of Police of the City of San Pablo, came to a different conclusion. He reported:
Based on our review of the most recent and objective statistical data relative to card club operations, "we could find no relationship between the rate of crime and the existence of a card club." (unpublished report to the City Manager of the City of San Pablo, December 3, 1993, p. 3).
He based his conclusion in large part on a study by political science professors Sandra Sutphen, Ron Grant, and Barbara Ball of California State University, Fullerton, who did a time series statistical study of crime rates in cities with and without card clubs from 1981 to 1991. They reported, "We could find no relationship between the rate of crime and the existence of a card club."
In summary, many, but not all, academic researchers have failed to find any connection between licensed gambling and crime in studies based on objective statistics. In contrast, a number of law enforcement officials have relied on anecdotal evidence to assert such a relationship.
Analysis
Card clubs, especially since the introduction of Asian games in 1984, generate sizable revenues and involve large cash transactions. Open 24 hours a day, seven days a week, they also involve a substantial number of people, employees of the clubs as well as players. The revenues and cash engendered naturally attract robbers; but most clubs provide excellent security on the premises, preventing most theft. At the same time, the clubs are diligent in preventing their own employees from skimming funds from the games.
Follow-home robberies do occur, although their frequency and significance does not appear to be great. Many of the clubs offer to redeem chips with a check to frustrate thieves. In all of Los Angeles County (population 9 million) during the first four months of 1992, the police reported sixteen follow-home robberies of patrons of the two major clubs — this amounts to 0.007 percent of all serious crimes in that county. In the absence of card clubs, would crime have fallen by sixteen cases in Los Angeles County or would the robbers have found their prey elsewhere, say possibly at a mall? That question has gone unanswered.
The large amount of cash involved has raised suspicions that card clubs are being used to launder money from drug dealing. Clubs are required to report any large cash transactions ($10,000 or more) to the IRS, but the Justice Department believes that compliance has been poor and that money is being laundered. Although it is difficult to measure this activity, making clubs illegal would simply lead to other methods of laundering. Nevada casinos and the smuggling of currency are reported to be used commonly to mask the origins of large funds.
Legal card clubs attract a large number of players to their facilities — Bay 101 averaged 3,850 people per day during a recent two-week period — and any large group of people is likely to attract criminals. Thieves, muggers, pickpockets — all find rich pickings in well populated areas. A city that licenses gambling may draw players from nearby communities or, in the case of Nevada, from other states. Thus the number of crimes in the city will probably rise; but, as Professors Sutphen, Grant and Ball have shown, the per capita crime rate, including visitors, may not. On the other hand, Bay 101, and presumably Garden City, attract almost exclusively a local clientele.
The United States Justice Department has asserted that Asian criminal groups have links to California card clubs and that these gangs increase crime and violence. Organized crime can flourish, however, without legal card clubs. In 1977 in card-club-free San Francisco, for example, two Chinese rival gangs opened fire in a local restaurant, killing five innocent bystanders and seriously wounding eleven.
Although hard proof is absent, most observers believe that gambling flourishes in cities that refuse to license card clubs. Knowledgeable people presume that in the Asian portions of San Francisco gambling is common, even though all games for money, including card clubs, (except the state lottery) are banned. Los Angeles is also riddled with unlicensed gaming establishments. Detective William G. Howell of the Los Angeles County Sheriff’s Department has testified before the U.S. Senate that "There are currently believed to be between 150 and 200 illegal underground gambling parlors operating in Los Angeles County." Prohibiting legal card clubs would not stop gambling but would drive it underground where it would be harder to police, giving rise to more illicit activity. According to a report by Edwin L. Miller, Jr., District Attorney for San Diego County in 1992:
Illegal mah jong games have been occurring within Asian/American communities for decades. … Mah jong games with stakes [h]as high as $500,000 per game are not unusual. When the players have been inclined, prostitutes have been provided by the illegal game operators. (Report in Opposition to CARDROOM CASINOS, August 1992, p. 13).
In short, if gambling is illegal, less of it will take place; but unauthorized games will continue. Although gamblers will have more difficulty finding a place to play, those most attracted to games of chance will find outlets. Prohibiting gambling by law may discourage some, in most cases the casual player, not only because of fear of the police but because the illegality of unlicensed games makes them more dangerous and less honest. An illicit establishment is likely to be run by people willing to break the law in other respects as well, thus contributing to an unsavory atmosphere.
On the other hand, those running a legal card club will have an incentive to abide by the law and cooperate with law enforcement officials. The prospect of losing its valuable license because of the sale of narcotics or because of prostitution will encourage the proprietors to discourage such activities on their premises. Thus an illegal casino or gambling parlor is more likely to have other crimes associated with it than would a licensed card club.
In the final analysis, an appraisal of the effect of licensed card clubs on crime comes down to determining whether legal clubs, which will encourage more gambling and therefore more loan sharking and follow-home robberies, increase crime more than a somewhat smaller amount of illegal gambling that is more directly associated with criminals and other illegal activity.
Evidence on Crime
A number of law enforcement officials, San Diego County District Attorney Edwin Miller, Jr. and the Chief of Police of San Jose, Louis A. Cobarruviaz, among them, have asserted that card clubs bring crime to their cities. Neither has produced objective evidence to back their position. These officials do not usually specify whether they expect card clubs to lead to more crime in and around the club or whether the effects would be felt throughout the city. Therefore, I have developed data on crime in and around the clubs and compared those figures with other parts of the city; I have also examined the relationship between the existence, number, and size of licensed card clubs and crime.
Crime in California Cities
If card clubs raise the level of crime in a city — through attracting unsavory individuals or though fostering a more permissive atmosphere or perhaps through impoverishing some who then resort to crime — then we should find that cities with licensed clubs experience higher crime rates than other cities. Some California cities have no legal card clubs; others have very small establishments with as few as two licensed table (Concord); still others have as many as 140 tables (Inglewood). (Appendix B lists the cities and the data.) The number of licensed clubs also ranges from zero to eight, with most cities that license any clubs at all approving only three or less. If crime is related to card clubs, cities with few licensed tables or only a few clubs should have less crime than those cities with a large number of gaming establishments.
An analysis must also take into account other factors that affect crime rates. Many conditions may influence crime, but poverty is most likely to be positively related to illegal activity. In addition, since young males are more likely to be involved in crime than other members of the community, a higher proportion of teenage and young adult men could boost the crime rate. Population density, wealth, education, the percentage of minorities, and size of the city might also be related to breaking the law. Employing these factors, I developed a statistical analysis of crime in the larger cities in California, those over 100,000 in population.
The data came from both federal and state sources. The United States Department of Justice publishes figures on crime for all cities with a population larger than 100,000. The 1995 Uniform Crime Report, published May 5, 1996, provided the preliminary numbers on serious offenses known to the police for major urban centers. The California Department of Justice, from its Gaming Registration Program, made available to me a list of all licensed card clubs in the state, their addresses, and the number of licensed tables in each club. These numbers and the data on cities from the County and City Data Book 1994 made possible a statistical analysis of the relationship between licensed card clubs and serious crime.
Since the data come from three separate sources, they are not totally comparable; they are, however, adequate to test the hypothesis that licensed clubs bring crime to cities. Ideally the figures utilized should correspond to the same period. Unfortunately, the State of California Game Registration Program could provide data only on current licensing (April 1996). The latest FBI crime statistics are for 1995 and the demographic data on cities from the County and City Data Book 1994 reflect conditions in 1993. Since licensed card clubs have a low rate of turnover, correlating April 1996 gaming figures with 1995 crime numbers should give valid results. Demographic variables also change slowly. Statistics and numbers of those in poverty for 1993 must correlate highly with those same variables for 1995 and can be employed in the analysis.
The published FBI Crime Index measures the total amount of serious crime in a community; on average large cities experience more crime than small. Dividing this number by the population of the cities yielded the Crime Rate — a measure of the level of serious crimes per capita. Those numbers were then regressed on various measures of demographics, education, age, income, and poverty suggested by sociologists and criminologists as related to criminal activity. The number of licensed card clubs, the number of licensed tables, and the size of the clubs as measured by tables per licensed club were included as independent variables. Only poverty and the proportion of minorities were related to crime. The percent of Asians in a community was also included but was unrelated in all regressions to crime. Consequently that variable was excluded from the final results presented in Table 1.
Table 1
Serious Crime Rates in 48 California Cities for 1995
|
|
1 |
2 |
3 |
|
Percent in Poverty |
3.65 (7.16) |
3.77 (8.16) |
3.55 (7.75) |
|
Percent Hispanic |
-0.68 (-4.28) |
-0.68 (-4.49) |
-0.62 (-4.09) |
|
Percent Black |
0.17 (0.70) |
0.40 (1.34) |
0.69 (2.02) |
|
Number of Card Clubs |
0.58 (0.54) |
|
|
|
Number of Licensed Tables |
|
-0.13 (-1.39) |
|
|
Avg Number of Tables per Club |
|
|
-0.26 (-2.13) |
|
Adjusted R2 |
0.63 |
0.64 |
0.66 |
|
F Statistics |
20.78 |
21.98 |
23.89 |
(t statistics in parenthesis)
These three regressions each explain about two-thirds of the variation (R2=.63 to .66) among the cities in the amount of crime per capita. The only difference between the equations is the measure of card club activity — number of card clubs, number of licensed tables, or average number of tables per club. The results are quite robust and more than meet the usual statistical tests of significance. These regressions demonstrate that the crime rate is unrelated to card clubs. Only the average number of tables per club licensed in a city is significantly related to crime and that relationship is negative, meaning that the larger the number of licensed clubs, the less crime in the community. Since there is more than one chance out of a hundred that this negative coefficient could be just a chance occurrence — that is, the size of the club has no effect — the grounds are too weak to believe that large card clubs actually reduce crime. More likely they have no affect.
As might be expected, crime appears to be related to poverty. A city with 10 percentage points more people in poverty will suffer about 36 to 37 more crimes per 100,000 population. It is worth noting that, once poverty has been taken into account, the percent of the population that is Hispanic is inversely related to crime. Fears of Mexican immigrants on the basis of crime are unwarranted. In fact, the more Hispanics, the lower the crime rate, given the level of poverty. Two out of three of the regressions show no relationship between the percent of African-Americans in the population and crime; the one positive correlation is weak and probably occurred by chance.
From this analysis we can conclude that legal card clubs do not bring an increase in more serious crimes within a city. These findings are consistent with those cited above — the study by Sutphen, Grant, and Ball. Nor should we be surprised by these results. There is no plausible scenario connecting licensed clubs to a rise in the crime rate.
Crime within San Jose
Nevertheless, it might be that card clubs cause problems in the area around or actually in the establishments themselves. Since such activity is not in the interests of the clubs themselves, this seems an unlikely result. In fact, the data show that there are relatively few serious crimes committed around or in the clubs.
In compliance with a Freedom of Information request, the San Jose Police Department released to me the figures on crime for various locations in the city. I requested tallies of the number of homicides, rapes, robberies, aggravated assaults, burglaries, and motor vehicle thefts reported in 1995. The sum of these offenses constitutes the California Crime Index, a widely reported measure of serious crime published annually for major California cities and counties. In addition, I asked for the number of larceny-thefts, drug offenses, and weapons charges reported during the same year.
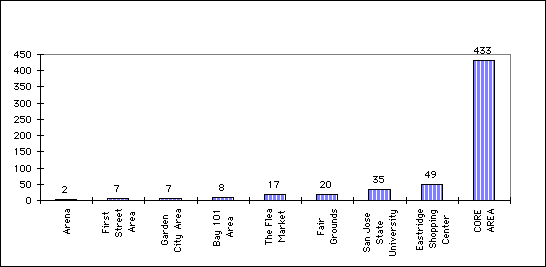
My request was for the number of serious crimes in nine areas in and around the City of San Jose. Not all of the locations were under the jurisdiction of the San Jose Police. After much delay, the City furnished me with the figures for the Arena, a two-block stretch of First Street (300 and 400 block of South First Street), the Garden City Area, Bay 101 Area, the Flea Market, East Ridge Shopping Center, and a core area of the down town. In addition, the San Jose State University Police furnished me with the figures for their campus and the Santa Clara Sheriff supplied me with the numbers for the Fair Grounds. (See Appendix A.)
Chart I shows the California Crime Index for each location. As may be seen, the card clubs (Bay 101 and Garden City) are two of the safest locations among the areas. Even the Flea Market experienced over twice the number of offenses reported at the card clubs. Serious crimes at the Eastridge Shopping Center, not generally considered a high crime location, were about seven times higher than those at the clubs. San Jose State University also experienced several times the amount of crime found at the card clubs.
Chart I
California Crime Index in San Jose by Selected Locations
(1995)
presents the overall figures, which include larceny-thefts, drug offenses, and weapons charges. For this measure of crime — nine offenses altogether — the card clubs experienced the fewest reported incidences. Even the Arena, considered by many to be a very safe location, experienced more calls for police action than either licensed club. Reported crime in the Eastridge Shopping Center climbed sharply when the somewhat less serious offenses were included. Altogether the data show that the card clubs are not a serious source of crime compared to other areas.
Chart II
The Total of Nine Major Crimes in Selected San Jose Locations
(1995)

The allegations about the connection between crime and licensed card clubs often assert that the clubs foster loan sharking, prostitution, and credit card fraud. Data on this type of activity are either nonexistent or so poor as to make positive conclusions impossible. According to the San Jose Police records, however, during Bay 101’s first year no cases of prostitution or loan sharking and only one case of credit card fraud were reported was reported. Bay 101 brought that one case to the attention of the police.
Prostitution is an under-reported crime since neither the patron nor the service provider has any motivation to notify the police. We might expect that any place that attracts males with money would attract prostitutes. The card clubs, however, have a special interest in discouraging such activity. They do not want to endanger their licenses. Moreover, they would like their clients to spend their funds on gambling, not on activities for which the clubs receive no compensation. Hotels and motels are much more likely to be venues of prostitution than are card clubs.
Loan sharking does probably occur, although both the borrower and the lender have an interest in avoiding police attention. The borrower might in some cases want to back out of his or her debts by calling in the police, but this would be dangerous. Moreover, such actions would cut the borrower off from future loans. In any case, the "victims" of loan sharking borrow on their own volition. Certainly the general community — those who don’t gamble or don’t borrow to do so — have nothing to fear from loan sharking.
Credit card fraud is unlikely to be more common at the card clubs than at other locations that accept credit cards. At the clubs, individuals can use their ATM cards to draw funds from their accounts, just as they do at a Safeway. They can also receive a cash advance from their credit card’s line of credit through an intermediary company called, Comdata. Since Comdata and the card clubs require better identification than is usually mandated at ATM machines that accept credit cards, fraud is less likely at the clubs then elsewhere.
As reported above, some law enforcement authorities have alleged that certain people become addicted to gambling. That number appears to be small since most of the people who visit Las Vegas or other centers of gambling are able to return to their homes and lead normal lives. The little evidence that exists suggests that about 5 percent of all gamblers become addicted (Governor’s Office of Planning and Research 1992, p. 16). For those few, gambling may well be addictive, but about the same proportion of people become addicted to alcohol. Smoking appears to be much more addictive and more harmful to the addict’s health.
Any business that attracts large numbers of people with lots of cash is going to experience some crime. The card clubs, however, are relatively free of illegal activities. In order to attract their clientele, they have a strong interest in providing a safe environment. They also enjoy a valuable franchise and it make no sense for the clubs to imperil their licenses. The allegation that the clubs attract crime appears to be based simply on an objection to gambling as a socially acceptable pastime.
Conclusions
The evidence indicates that crime around the licensed card clubs within San Jose is no greater and probably less than would be expected of any business that attracted a large clientele. During 1995, the number of reported crimes was fewer than can be counted on two hands. In return, the city earned significant fees. Moreover, the statistical evidence from the state as a whole shows that card clubs do not increase crime. The licensing of these clubs provides a safe venue relatively free of serious crime for those wishing to gamble. The alternative of prohibition will force some into illegal gambling dens, where serious crimes are more likely.
Appendix A
Data on Crime in San José
Specific Locations for Crime Data
|
Place |
Address |
|
Arena |
W. Santa Clara & Guadalupe Parkway |
|
First Street Area |
300 and 400 block of South First Street |
|
Garden City Area |
360 S. Saratoga Avenue |
|
Bay 101 Area |
1801 Bering Drive |
|
Flea Market |
12000 Berryessa Rd. |
|
Fair Grounds |
Tully Road |
|
San Jose State University |
E. San Franando, 9th St., E. San Carlos, 4th St. |
|
Eastridge Shopping Center |
Tully Road off of 101 |
|
CORE AREA |
Old Julian St. and Julian St., I-280, 4th Street, and State Highway 87 |
Table 1
Reported Crimes During 1995 in Selected Areas of San José
|
Place |
Homi-cide |
Rape |
Rob-bery |
Aggra-vated Assault |
Bur-glary |
Motor Vehicle Theft |
CA Crime Index |
|
Arena |
1 |
1 |
2 |
||||
|
First Street Area |
1 |
2 |
3 |
1 |
7 |
||
|
Garden City Area |
3 |
4 |
7 |
||||
|
Bay 101 Area |
1 |
7 |
8 |
||||
|
Flea Market |
4 |
2 |
1 |
10 |
17 |
||
|
Fair Grounds |
1 |
2 |
7 |
9 |
1 |
20 |
|
|
San Jose State University |
2 |
5 |
23 |
5 |
35 |
||
|
Eastridge Shopping Center |
6 |
4 |
35 |
4 |
49 |
||
|
CORE AREA |
2 |
19 |
60 |
156 |
100 |
96 |
433 |
Table 2
Other and Total Offenses During 1995 in Selected Areas
|
Place |
Larceny-Theft |
Drug Offenses |
Weapons |
All Offenses |
|
Arena |
16 |
3 |
21 |
|
|
First Street Area |
17 |
2 |
26 |
|
|
Garden City Area |
6 |
2 |
15 |
|
|
Bay 101 Area |
8 |
3 |
19 |
|
|
Flea Market |
15 |
32 |
||
|
Fair Grounds |
11 |
7 |
3 |
41 |
|
San Jose State University |
169 |
69 |
13 |
286 |
|
Eastridge Shopping Center |
644 |
21 |
7 |
721 |
|
CORE AREA |
490 |
289 |
35 |
1247 |
Appendix B
Data on California Cities
|
Crime per 100,000 |
Percent in Poverty |
Percent Hispanic |
Percent Black |
No.of Card Clubs |
No.ofCard Tables |
No of Tables/Clubs |
|
|
Anaheim |
63.5 |
10.6 |
31.4 |
2.5 |
0 |
0 |
0.0 |
|
Bakersfield |
73.4 |
15.0 |
20.5 |
9.4 |
5 |
28 |
5.6 |
|
Berkeley |
112.9 |
17.5 |
8.4 |
18.8 |
0 |
0 |
0.0 |
|
Chula Vista |
62.5 |
9.8 |
37.3 |
4.6 |
3 |
23 |
7.7 |
|
Concord |
68.1 |
6.7 |
11.5 |
2.4 |
1 |
2 |
2.0 |
|
El Monte |
48.3 |
22.5 |
72.5 |
1.0 |
0 |
0 |
0.0 |
|
Escondido |
70.7 |
11.2 |
23.4 |
1.5 |
0 |
0 |
0.0 |
|
Fontana |
63.4 |
11.4 |
36.1 |
8.7 |
0 |
0 |
0.0 |
|
Fremont |
48.1 |
4.3 |
13.3 |
3.8 |
0 |
0 |
0.0 |
|
Fresno |
123.0 |
24.0 |
29.9 |
8.3 |
4 |
52 |
13.0 |
|
Fullerton |
56.4 |
9.8 |
21.3 |
2.2 |
0 |
0 |
0.0 |
|
Garden Grove |
53.0 |
10.4 |
23.5 |
1.5 |
0 |
0 |
0.0 |
|
Glendale |
44.7 |
14.4 |
21.0 |
1.3 |
0 |
0 |
0.0 |
|
Hayward |
69.4 |
9.7 |
23.9 |
9.8 |
1 |
8 |
8.0 |
|
Huntington Beach |
43.7 |
5.2 |
11.2 |
0.9 |
0 |
0 |
0.0 |
|
Inglewood |
61.4 |
16.5 |
38.5 |
51.9 |
1 |
140 |
140.0 |
|
Irvine |
39.8 |
6.4 |
6.3 |
1.8 |
0 |
0 |
0.0 |
|
Lancaster |
59.1 |
9.9 |
15.2 |
7.4 |
0 |
0 |
0.0 |
|
Long Beach |
69.8 |
16.8 |
23.6 |
13.7 |
0 |
0 |
0.0 |
|
Los Angeles |
76.3 |
18.9 |
39.9 |
14.0 |
1 |
70 |
70.0 |
|
Modesto |
91.0 |
13.0 |
16.3 |
2.7 |
2 |
9 |
4.5 |
|
Moreno Valley |
69.6 |
8.4 |
22.9 |
13.8 |
0 |
0 |
0.0 |
|
Norwalk |
49.2 |
9.3 |
47.9 |
3.2 |
0 |
0 |
0.0 |
|
Oceanside |
54.2 |
10.1 |
22.6 |
7.9 |
3 |
32 |
0.0 |
|
Ontario |
74.7 |
13.6 |
41.7 |
7.3 |
0 |
0 |
0.0 |
|
Orange |
43.3 |
8.0 |
22.8 |
1.4 |
0 |
0 |
0.0 |
|
Oxnard |
53.6 |
12.5 |
54.4 |
5.2 |
0 |
0 |
0.0 |
|
Palmdale |
61.1 |
8.9 |
22.0 |
6.4 |
0 |
0 |
0.0 |
|
Pasadena |
70.7 |
14.9 |
27.3 |
19.0 |
0 |
0 |
0.0 |
|
Pomona |
60.5 |
18.4 |
51.3 |
14.4 |
0 |
0 |
0.0 |
|
Rancho Cucamonga |
43.6 |
5.5 |
20.0 |
5.9 |
0 |
0 |
0.0 |
|
Riverside |
82.4 |
11.9 |
26.0 |
7.4 |
0 |
0 |
0.0 |
|
Sacramento |
101.3 |
17.2 |
16.2 |
15.3 |
8 |
37 |
4.6 |
|
Salinas |
72.4 |
15.6 |
50.6 |
3.0 |
6 |
20 |
3.3 |
|
San Bernardino |
112.3 |
22.8 |
34.6 |
16.0 |
0 |
0 |
0.0 |
|
San Diego |
55.9 |
13.4 |
20.7 |
9.4 |
6 |
21 |
3.5 |
|
San Francisco |
82.6 |
12.7 |
13.9 |
10.9 |
0 |
0 |
0.0 |
|
San Jose |
45.1 |
9.3 |
26.6 |
4.7 |
3 |
81 |
27.0 |
|
Santa Ana |
52.7 |
18.1 |
65.2 |
2.6 |
0 |
0 |
0.0 |
|
Santa Clarita |
33.0 |
3.7 |
13.4 |
1.5 |
0 |
0 |
0.0 |
|
Data on California Cities: Continued |
|||||||
|
Crime per 100,000 |
Percent in Poverty |
Percent Hispanic |
Percent Black |
No.of Card Clubs |
No.ofCard Tables |
No of Tables/Clubs |
|
|
Santa Rosa |
62.6 |
8.3 |
9.5 |
1.8 |
2 |
9 |
4.5 |
|
Simi Valley |
28.1 |
3.6 |
12.7 |
1.5 |
0 |
0 |
0.0 |
|
Stockton |
94.5 |
21.4 |
25.0 |
9.6 |
3 |
16 |
5.3 |
|
Sunnyvale |
32.0 |
4.7 |
13.2 |
3.4 |
0 |
0 |
0.0 |
|
Thousand Oaks |
25.4 |
4.2 |
9.6 |
1.2 |
0 |
0 |
0.0 |
|
Torrance |
56.2 |
5.1 |
10.1 |
1.5 |
0 |
0 |
0.0 |
|
Vallejo |
79.3 |
8.5 |
10.8 |
21.2 |
0 |
0 |
0.0 |
|
West Covina |
55.6 |
7.7 |
34.6 |
8.5 |
0 |
0 |
0.0 |
Descriptive Statistics for Variables
|
Crime/ Pop |
Percent Poverty |
Percent Hispanic |
Percent Black |
No.of Card Clubs |
No.of Card Tables |
No of Tables/Clubs |
|
|
Mean |
63.56 |
11.70 |
26.05 |
7.76 |
1.02 |
11.42 |
6.23 |
|
Standard Error |
3.10 |
0.78 |
2.18 |
1.23 |
0.28 |
3.80 |
3.25 |
|
Median |
61.27 |
10.5 |
22.85 |
5.55 |
0 |
0 |
0 |
|
Standard Deviation |
21.4 |
5.4 |
15.1 |
8.5 |
1.93 |
26.31 |
22.5 |
|
Sample Variance |
460 |
29 |
228 |
73 |
3.72 |
692.4 |
507 |
|
Range |
97.61 |
20.4 |
66.2 |
51 |
8 |
140 |
140 |
|
Minimum |
25.44 |
3.6 |
6.3 |
0.9 |
0 |
0 |
0 |
|
Maximum |
123.05 |
24.0 |
72.5 |
51.9 |
8 |
140 |
140 |
|
Mean/standard error |
20.53 |
15.08 |
11.95 |
6.30 |
3.67 |
3.01 |
1.92 |
References
Governor’s Office of Planning and Research, State of California, CALIFORNIA AND NEVADA: Subsidy, Monopoly, and Competitive Effects of Legalized Gambling. December 1992.
Hakim, Simon and Andrew J. Buck. "Do Casinos Enhance Crime?" Journal of Criminal Justice, 17 (1989): 409-416.
Bradbury, Michael D. "A Public Report to the Oxnard City Council: ‘Cardroom Casinos: the Promise and the Reality.’" June 22, 1993.
Sutphen, Sandra, Ron Grant, and Barbara Ball. "Upping the Ante: Gambling as a Revenue Source for Local Governments" Southeastern Polical Review. 1993.
FinCEN Research Series. "Asian Organized Crime: The California Card Clubs." March 1993, Report OSA92GP0003, Financial Crimes Enforcement Network.
Miller Jr., Edwin L. "Report in Oppositin to Cardroom Casinos," Report of District Attorney, San Diego County, CA. August 1992.
Statement of Detective William G. Howell, Los Angeles County Sheriff’s Department before the Permanent Subcommittee on Investigations of the Committee on Government Affairs, United States Senate, June 18, 1992.
Statement of Robert W. Koppe, Jr., Assistant Director, Office of Strategic Analysis, Financial Crimes Enforcement Network, U.S. Department of the Treasury, before the Permanent Subcommittee on Investigations of the Committee on Government Affairs, United States Senate, June 18, 1992.