Convolutional Neural Networks for Underwater Bedform Inference
What lies underwater?
Proof-of-concept for potential underwater bedform inference from only drone-imaging of the free-surface of flow
(Interactive code for below project is available on Github. This section is an overview of material published in Journal of Fluid Mechanics. Read the full manuscript here.)
Introduction
Looking down on the San Francisco Bay from the Golden Gate Bridge, one wonders if the patterns on the water surface can reveal anything about the gross characteristics of the bottom bedrock of the bay – are there vegetation canopies? Are there sand dunes? Are there rocky patches? One asks – what lies underneath? And can we predict that by ONLY taking aerial images (say with a drone) of the water surface? Seem intangible, doesn’t it? You’re in for a surprise – it’s not!
From hydrodynamic theory, we know that underwater bedforms will leave signatures on the free surface of the flow. But as I will demonstrate, under certain conditions, we can in fact leverage these signatures to infer things about characteristics of the bedforms. This technology can be a critical addition to the remote sensing community because all existing methods for remote sensing underwater bedforms break-down for muddy waters, thus leaving many underwater coastal and riverine channels unmapped. Which is sad. Marine & coastal ecosystems need to be mapped for sustainability assessments; maritime and shipping corridors need to be mapped for hazardous coral or rocky out-growths; and there has been interest in the naval community for mapping underwater vehicles such as submarines by looking at their free-surface hydrodynamic signatures alone! Isn’t that cool? What follows is my deep learning framework for proof-of-concept of this inference principle using laboratory data
Outline of Approach & Data
Detailed code is available on Github. The computations were done on EC2 instance of AWS.
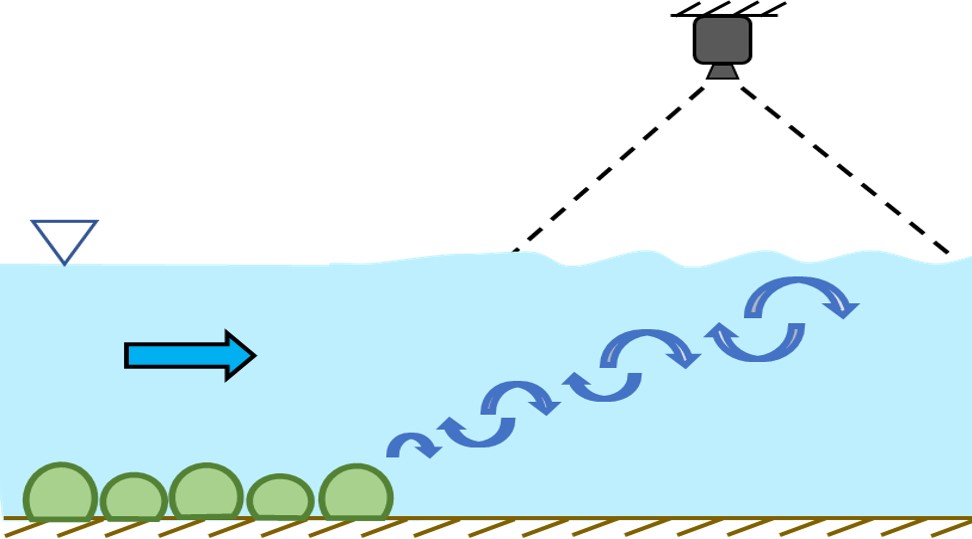
(On the right, schematic of the lab experimental setup. Camera only sees the free-surface of flow)
I carried out laboratory experiments at Stanford’s open-channel water tunnels for 4 different submerged bottom treatments (namely, ‘corals’, ‘vegetation canopies’, ‘rocks, ‘dunes’) and a variety of flow conditions and acquired overhead images of the free surface. The data is therefore set of images taken for the different bedforms and the label being the correpsonding bed. I used these to train Convolutional Neural Network (CNN) based classifiers and formulated the problem as a multi-class classification one with the goal of correctly classifying a set of test images into the 4 bedform classes. The training of models is agnostic to the flow conditions, i.e. all flow cases for a given bedform have the same label.
Please note that I am all for open science!. If you are interested in actually tinkering with the wealth of images I have taken, you can email me and we can work out a way of providing you access.
Model Parameters
Below is a summary. Reader is encouraged to see here for details of results & approach.
Architecture: Instead of using state-of-the art classifiers such as ResNet, AlexNet, LeNet, VGG-16, I designed my own architecture suited to my needs. CNN based classifiers were built using the Keras library that uses tensorflow-v2 as its backend. I stacked four {convolution + relu + maxpooling} modules followed by two fully connected layers (see figure below). Convolution filters operated on 16×16, 10×10, 5×5, and 3×3 windows with a stride of 1 and the same padding. Our maxpooling layers operated on 2×2 windows with a stride of 2. There were 16, 16, 32, and 64 filters, respectively, for each convolutional layer.
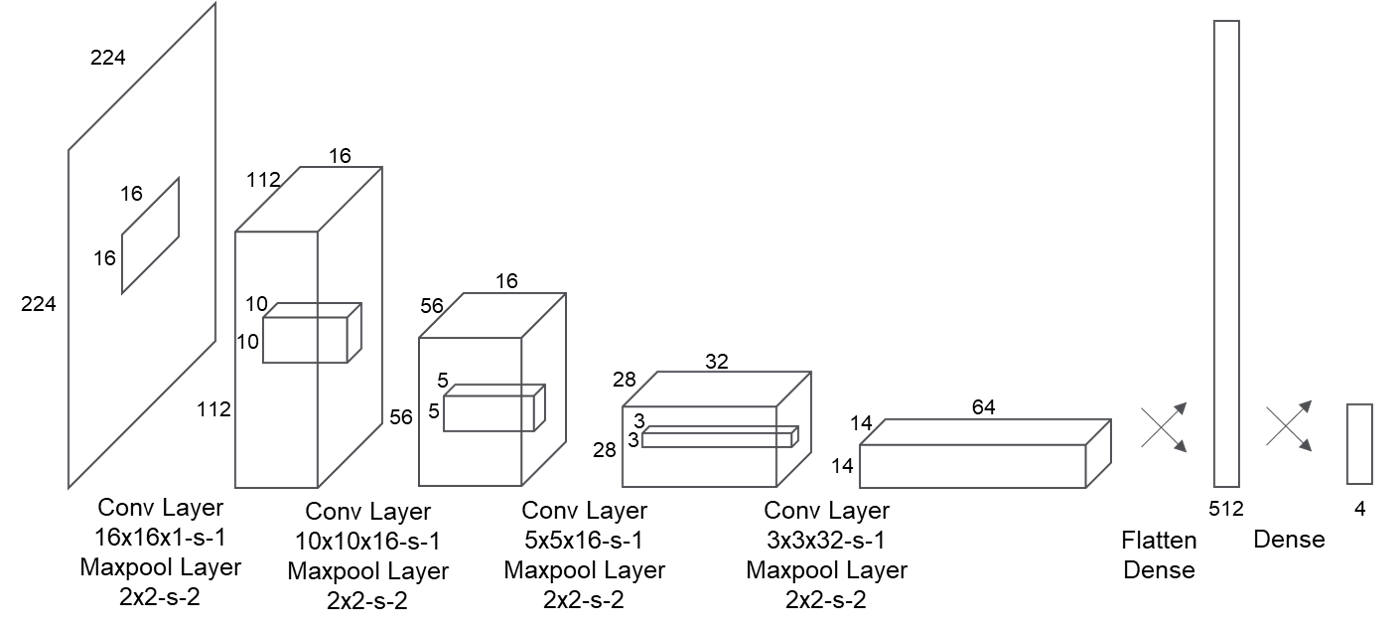
Figure: The Neural Network Architecture used for this study
I trained the model with the categorical crossentropy loss, because we are solving a multi-class classification problem. Last layer activation was softmax, so that the output of the model for a given image can be interpreted as the probability that an image belongs to a given class. For model optimization during training, I used the RMSProp optimizer with a learning rate of 0.001 and a training batch size of 50 images with accuracy as the guiding metric. Training was carried out for 30 epochs.
Preprocessing: To make the free-surface patterns observed in the raw images more pronounced, I subtracted consecutive frames (taken at a rate of 16 frames per second) to create “difference” images, which were used for all of my analyses. All images fed into this model were rescaled to 224×224 pixels, a standard number used for computational efficiency without compromising too much on the pixel information (which of course is somewhat lost in the scaling and resizing process). When building the training and training-development sets, I randomly shuffled the difference images so as not to inadvertently include temporal correlations.
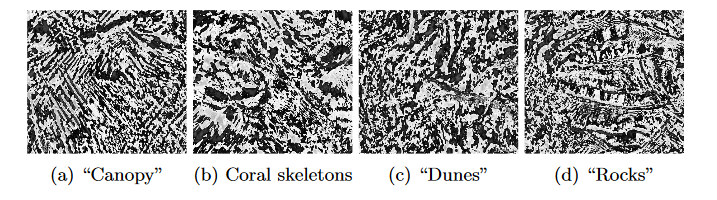
Sample “difference” images for the free-surface signatures due to different beds. Flow direction is from bottom to top in the images
Sizes of the training, training-development, and test sets: The precise sizes of the image sets used for the different models varied, but in all cases were empirically determined to be large enough to give stable results. The training sets ranged from 24,000 to 48,000 images; the training-development sets from 1200 to 1600 images; and the test sets from 4800 to 8000 images. In all cases, equal numbers of images were used for each of the four bottom treatments.
Results
1. Classification of bedforms in the absence of free-surface winds
To examine whether a measurable signature of the different bedforms was present at the free surface, I trained nine different CNNs on sets of images acquired from flows with different bedforms and flow conditions but no wind ruffles. The nine CNNs differed in that their training and training-development sets consisted of images taken for all four bedform types but only eight of the nine different flow configurations. The images for the remaining flow condition (but again for all four bedforms) constituted the test set. These are called the 1-holdout test cases. Below are the confusion matrices for the 9 different holdout-models. I also quantified the overall percent accuracy for all cases.
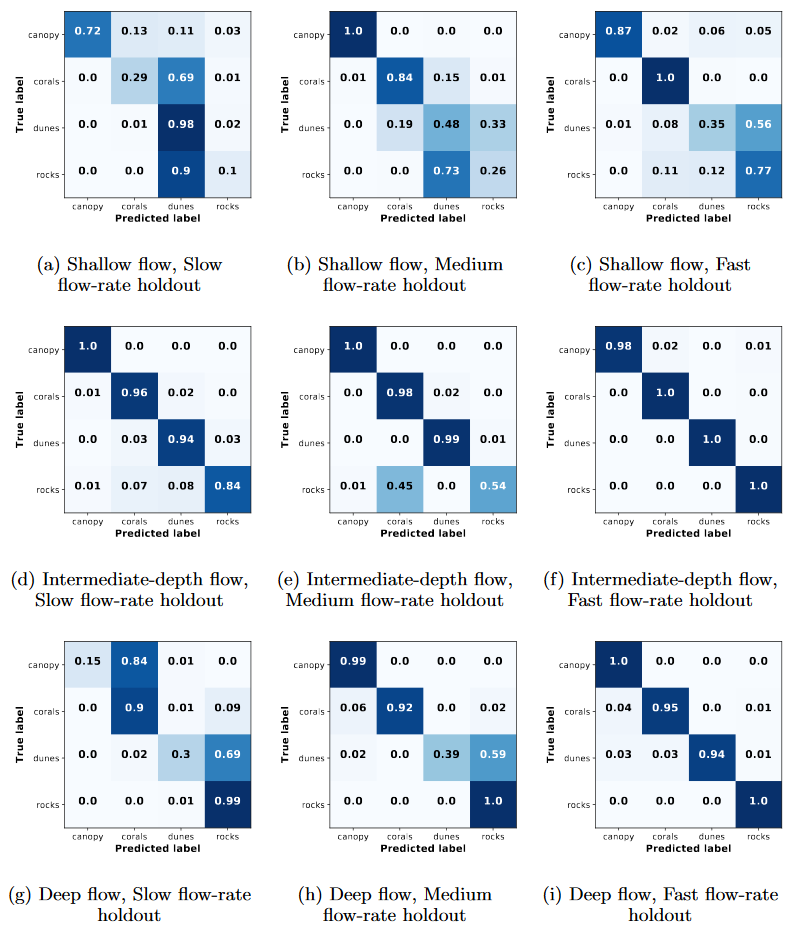
Takeaway Insight: All nine CNNs perform significantly better than random chance, which would give an accuracy of 25%. This result suggests that the CNNs have indeed learned to pick out informative features from the images of the free surface that accurately identify characteristics of the bottom bathymetry, giving strong evidence that such surface signatures exist.
2. Classification of bedforms in the presence of free-surface winds
In actual environmental flows of interest, distortions of the free surface will arise both from bottom features and from stresses applied directly at the surface by phenomena such as wind. One might anticipate that if these direct surface effects are strong enough, they will overwhelm the surface signature of any bottom features. To explore this hypothesis, I conducted a series of experiments where I introduced surface winds over the water surface and again used CNNs to attempt to classify the bottom features. I did this in two ways.
2.1 Classifiers trained on flows without winds
I trained a CNN classifier only on images taken for flows with no imposed wind and tested its performance on experimental cases with imposed winds. Here the performance of the CNN in classifying the images in these test cases was significantly degraded by the presence of surface disturbances due to the wind: I found that the accuracy of the classifier was 33%, 35%, and 36% for wind speeds of 1.6m/s, 2.2m/s, and 2.6m/s, respectively (confusion matrices shown below)
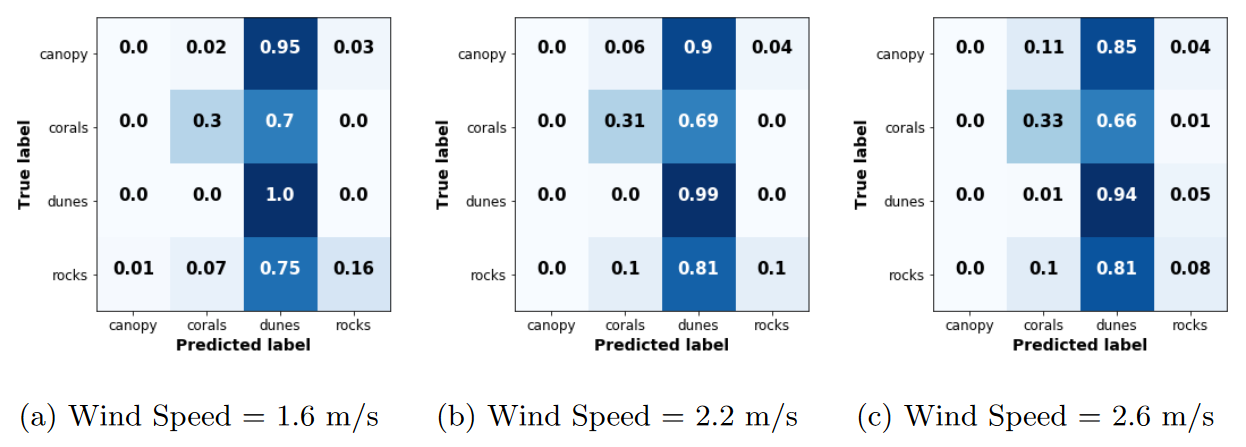
Figure: Confusion matrices for test classification for classifiers trained in absence of winds but tested on wind images
Takeaway Insight: The condusion matrices reveal that the accuracy of the CNN is low because almost all cases are classified as dunes, regardless of the actual bedform. This result is not necessarily surprising. The fan that generated the wind in experiments was oriented along the centerline of the water tunnel; thus, one would expect that the dominant features produced by the wind would be surface waves spanning the width of the tunnel with their crests oriented along the spanwise direction. Of the four model bedforms used, only our model dunes shared this symmetry. Thus, it would appear that the CNN, as trained on images with no wind, learned that the surface signature of dunes involves features with a geometry shared by the features produced by wind—and thus consistently tended to classify windy images as dunes.
2.2 Classifiers trained on flows with winds
To establish whether wind unavoidably destroys the possibility of classifying bottom features or whether instead different features must be used to discriminate between the types of bedforms, I trained two CNNs on training sets that included images taken from cases with wind in addition to cases without wind. For each CNN classifier, I held out one data set from the training set of images to use as the test set. The accuracies this time were very good (upwards of 75%).
Takeaway Insight: These results suggest that although the presence of imposed surface disturbances due to wind adds additional complexity to the classification problem, they do not eliminate the surface signature of the bedforms.
Conclusion
The results give strong evidence that the free-surface disturbances caused by submerged features can carry sufficient information to identify at least the gross characteristics of the feature. I have also shown that although directly imposed surface disturbances such as winds may also modulate the free surface, they do not necessarily preclude the identification of the submerged feature provided that appropriate information is used.