Word2Vec as an Embedding Strategy for Medical Prediction using EHR data
Ongoing work in collaboration with Dr. Adam Papini and Alejandro Salinas; advised by Dr. David Kim at Stanford’s Department of Emergency Medicine
Introduction
Since the introduction of the Health Information Technology for Economic and Clinical Health Act in 2014, there has been an explosion in the rate of creation of digital health data. As of 2018, it has been reported that healthcare data alone accounts for about 30% of the world’s data production. Such large-scale electronic medical records and administrative datasets, collected in the United States passively by state health authorities, have huge potential for various clinically relevant prediction tasks using deep learning. Such tasks include but are not limited to learning insights from patient health trajectories, treatment patterns, predicting future diagnosis code or risk of readmission, and mortality.
The state-of-the-art literature for many of these efforts is largely focused on optimizing deep learning model architectures. Electronic Health Record (EHR) data is very high dimensional, often reaching tens of thousands of features and contains categorical variables pertaining to demographic information, diagnostic codes and procedure codes. Embeddings are vector representations of high-dimensional data that group syntactically similarly data together while also reducing the dimensionality of the feature space. The use of embeddings has been shown to improve model performance significantly for natural language prediction tasks. In this study, ourt aim was to apply this strategy to various medical prediction tasks, one of which forms the content of this blog post. Of course, feel free to reach out for details as I have kept things fairly high-level here and a lot of design decisions went in at every stage, only some of which are shared here.
For determining effective preventive measures for discharged ER patients and to determine future allocation of medical resources, there is significant interest in the medical community in trying to predict the future ailment category that a patient can be expected to be re-hospitalized with based on their medical history. The goal of this particular piece of work is to predict the most likely future ER visit category for a patient based on their 2 prior visits. In particular, I will discuss a recurrent neural network based architecture and the effect of using word2vec embedding strategy on the prediction performance. The model is trained on EHR data of a large number of patients and their visits across California ERs tracked from 2015-2018.
Cloud workhorse
We used Google Cloud Platform for all the investigations given the large size of our dataset, containing nearly 28 million patient visits with 4.5 million unique patients. We required a high-memory instance with 60 GB memory and an NVIDIA P100 GPU to embed our feature space and train our Recurrent Neural Network based deep learning model.
What’s the Data and the Setup?
Administrative level data is collected by health systems to monitor admission, diagnostic, and procedure information both for the tracking of resource utilization and for remuneration. This represents a rich data set that can be used by deep learning models for prediction. International Classification of Diseases (ICD-10) and Current Procedural Terminology (CPT) codes are typically used in the United States to code for diagnoses and procedures during hospital stays. There are approximately 70,000 ICD-10 diagnostic codes.
Applying deep learning algorithms to these large datasets for instance at the level of a state or large insurance provider can have in the order of 100s of millions of visits. Using upwards of 80,000 features for the possible CPT and ICD codes can quickly lead to unwieldy datasets with massive sizes. Furthermore, much like natural language where two words can have the same meaning, two ICD codes can also share similar meaning for instance:
- E1052: Type 1 diabetes mellitus with diabetic peripheral angiopathy with gangrene.
- E1352: Other specified diabetes mellitus with diabetic peripheral angiopathy with gangrene
Due to the nature of this type of data we can “borrow” techniques from Natural Language Processing (NLP) to improve our data pipeline and ultimately prediction quality.
The data is supplied by the California Office of Statewide Health Planning and Development. This structured EHR data is available in the CSV file format. It contains information on patient trajectories (with at least 3 visits) in California from October 2015 - December 2018. These data reflects 27,977,932 visits for 4,520,199 unique patients. For every patient we have demographics related payloads and there are other diagnostic codes which together constitute 88 different payloads.
As seen in the figure below for the headers of the demographics information for each patient, there is a unique patient identifier, visit number for that patient in the dataset and the total number of visits, along with the date of visit and age-sex-race-address related demographic data for patients. The snippet below shows the demographic field headers. Note that none of the data is shown to ensure that the data remains private even though the data was already deidentified.

For each patient visit, the EHR dataset contains information on the primary payer for that visit (Medicare, Medicaid, private, etc.), length of stay in case the patient was admitted, up to 25 ICD-10 diagnosis codes associated with that visit, up to 5 additional ICD-10 diagnosis codes specifically reflecting “external causes of injury”, and up to 20 procedure codes.
Problem Overview
Embeddings are commonly used in NLP to vectorize symbolic representations such as words. This technique can also be applied to tokenized features such as diagnostic and procedure codes. Embeddings allow reduction in feature space and out-preform simpler methods such as bag-of-words models. This strategy has been used and validated for extraction from free text medical records, but has only been validated on small datasets of ICD-10 codes.
Significant research in the field has been focused on labelling free text discharge summaries and other medical free text with relevant ICD and procedural codes. State-of-the-art NLP embedding methods such as BERT have been applied to this problem with successful results. However, there is less research and knowledge about the optimal use of embedding methods on non-free text structured data such as that found at the administrative level.
Here I seek to illustrate the use of word2vec and other different state-of-the-art embedding strategies on medical predictions using a large administrative level dataset with greater than 25,000,000 patient visit instances.
-
Input: Demographic and ICD10 diagnostic codes for two sequential visits to the Emergency Department(ED).
-
Experiment: Word2Vec embedding strategy detailed later (See here for an excellent discussion of word2vec for natural language tasks). Embedding feature vectors are separately fed into an LSTM based deep learning model.
-
Output: Visit classification prediction of patient’s third visit from one of 7 visit classification categories.
The aim is to predict next visit category based on past visits using patient demographics combined with ICD-10 diagnostic codes.
Using this prediction task as a model we plan to evaluate how well does word2vec embedding strategy work compare to some of the SOTA embedding methods. This work hopefully contributes to knowledge that can be used by others to inform best practices for selecting embedding strategies.
Data Labelling
Data did not come pre-labelled for prediction, therefore we chose the primary ICD code for a patient for that visit dictionary to give visits a appropriate visit category. Possible categories include :
- Circulatory
- Dermatologic
- Endocrine and Immune
- Gastrointestinal
- Genitourianry
- Hematologic
- Infectious
- Injury and Poisoning
- Muskuloskeletal
- Neoplastic
- Neurologic
- Obstetric
- Psychiatric
- Respiratory
- Substance Use
- Other
But as can be seen in the figure below patient labels were not balanced. Therefore labels were reduced to categories that are reasonable from a biomedical standpoint.
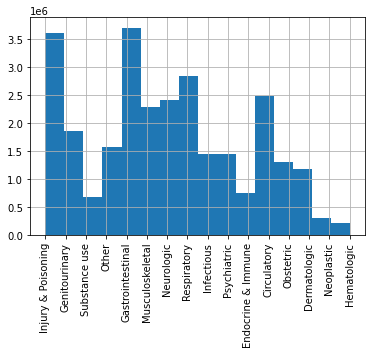
The visit labels were concatenated into 7 medically justifiable categories to reduce class imbalance without excluding entire visit categories from analysis:
- Circulatory
- Gastrointestinal
- Injury & poisoning
- Neurologic
- Other (a miscellaneous category)
- Obstetric
- Infectious
In our model we assign a “ground-truth” label feature by taking the principal ICD code for each visit and matching it to a category from the data dictionary.
Descriptive statistics
It is valuable to look at the age distribution, and #visits per patient distribution so as to allow for both building reasonable models as well as inferring the results. The below two figures illustrate these statistics for the dataset at hand.
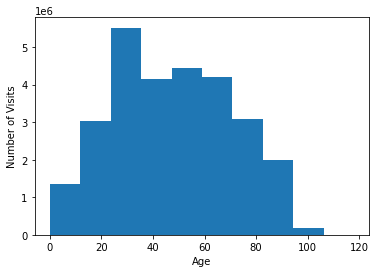
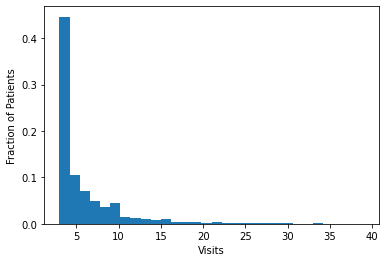
The mean patient age was 48 with a standard deviation of 22. Patients were 56% female with a total of 786 listed as unknown sex. The dataset was restricted to patients with at least 3 visits. The total number of visits per patient had a left skew with the majority of patients having 3 visits during the observation window as can be seen in the figure above.
Approach and Architecture
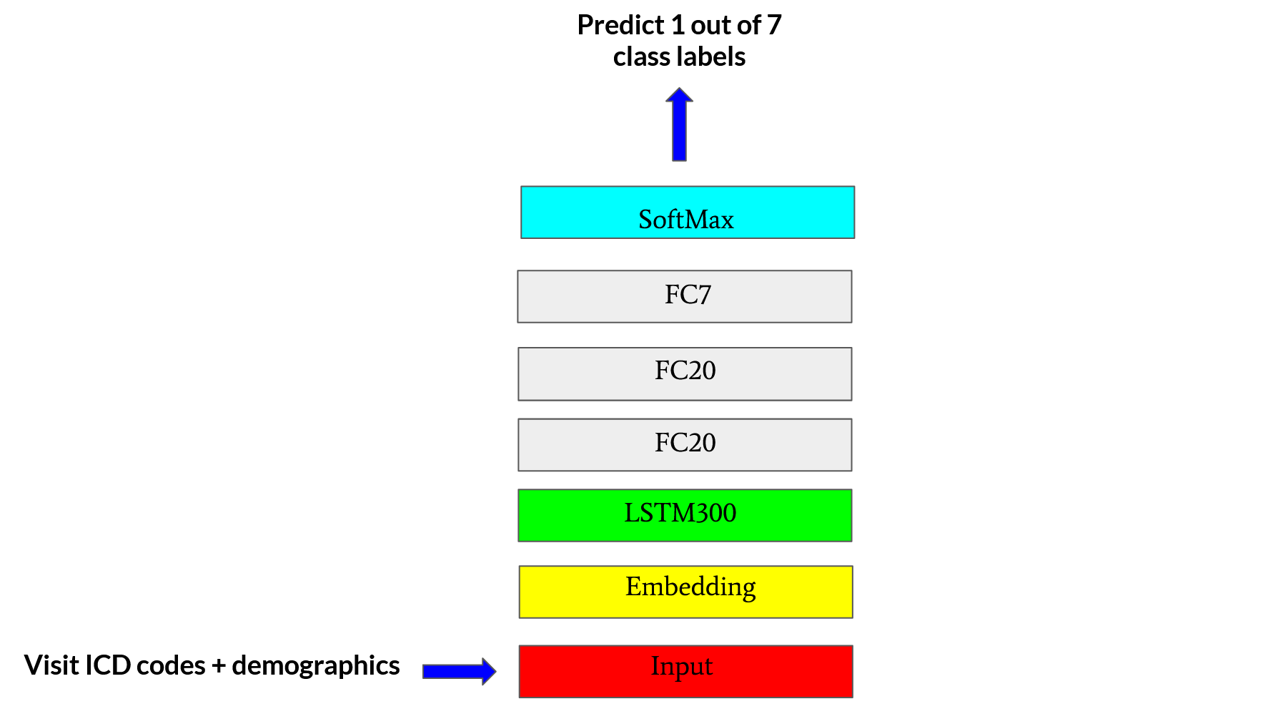
The use case for this post, more concretely, is to use two (consecutive) labeled medical records for a patient to predict the visit category for the same patient on the third (next) visit. This can be achieved by training a multi-class classification prediction model to predict one of the seven different ER visit categories which we bucket the patients into based on the primary ICD10 diagnosis code for a visit. For this use case, we design an LSTM based deep learning architecture to enable us to find “optimal” ways to embed patient medical and demographic records on a visit-to-visit basis. The model architecture is shown in the figure below.
BATCH_SIZE = 128
EPOCHS = 10
NUM_LSTM_UNITS = 300

# BUILD THE MODEL BY ADDING LAYERS
model = tf.keras.models.Sequential()
model.add(tf.keras.layers.LSTM(units = NUM_LSTM_UNITS,input_shape= (train_X.shape[1], train_X.shape[2])))

# add dense units
model.add(tf.keras.layers.Dense(units = 20, activation='relu'))
model.add(tf.keras.layers.Dense(units = 20, activation='relu'))

model.add(tf.keras.layers.Dense(units = NUM_CLASSES, activity_regularizer = tf.keras.regularizers.l1_l2(l1=0.01, l2=0.01), activation='softmax'))

# patient early stopping
es = tf.keras.callbacks.EarlyStopping(monitor='val_loss', mode='min', verbose=1,patience=8)
# COMILE THE MODEL
model.compile(loss='categorical_crossentropy', optimizer=tf.keras.optimizers.Adam(learning_rate=0.001),metrics=['accuracy'])
Predictive Model Framework
We created a Sequential Keras model as seen above. The inputs are 3D tensors and the shape of these tensors is [n_samples, n_timesteps, n_features]. Here n_samples is the number of training examples. Each input example for the model consists of 2 embedding vectors corresponding to 2 consecutive ER visits for a patient which means n_timesteps = 2. The n_features = 311 because each embedding vector contains 311 features in total. In other words, each sample is a multivariable time series with 311 variables and 2 timesteps.
The ground-truth label for each such example is the category label for the “third” (next) visit. The labels for the pair of visits in the example are themselves not used for the current example. To create many training examples, we use a sliding window approach to extract more than one such consecutive-visit-triplets for each patient if the patient in fact visited more than 3 times. We then pick a **balanced number of examples **for each of the 7 classes and divide them into train-val-test sets using a 95-2.5-2.5 split.
This 3D tensor is fed into a 300 unit LSTM layer. The output of this layer is then fed into 2 consecutive fully connected Dense layers with 20 hidden units each having relu activation. The final dense layer has 7 units for the 7 classes and final softmax activation. We trained the model for up to 75 epochs and in some cases used early stopping. The optimal batch size was found to be 128 examples. The model was trained with the categorical cross-entropy loss for the one-hot encoded prediction labels. The evaluation metric was accuracy and learning rate was 0.001. The model structure is shown in the figure above. We also implemented L1 and L2 regularization along with manual early stopping for model based on inspection of validation loss. L1 and L2 activity regularizer coefficients are 0.01 each for L1, L2 regularizations.
Learning the Word2Vec Embedding for Prediction
Here the goal is to learn the word2vec embeddings from the dataset so that each patient visit can be embedded for the predictive RNN discussed above. The notebook that walks through this process is shared here. This is a tabular dataset where each row is a patient visit, containing not only their demographic information but also 25 possible ICD-10 codes that they were diagnosed with during that visit to the ER. More specifically, we intend to learn the feature representation (vector) of every code that appears in this data. Each visit will be treated as a sentence, wherein the “words” will the various codes that the patient was diagnosed with. The adjacent codes in a sentence will form context windows.
First, we one-hot encoded specific features about the patient including ‘Sex’ and ‘Race’. We also incorporated their age, which was integer encoded to nearest multiple of 5. Between these three features, we produced a one-hot encoding of size (1, 11) for each patient.
Second, we found word2vec embedding vectors for patient visits that contain anywhere from 1 to 25 ICD-10 codes, representing the diagnoses of the patient. We converted each ICD-10 code to its CCSR representation. In essence, CCSR codes help to represent the tens of thousands of ICD-10 codes into a condensed smaller space of less than a 1000 codes by clubbing similar codes under the same umbrella. We treated each visit then as a sentence composed of all the CCSR representations of the ICD-10 codes for that visit for that patient. We used Pyspark and PyArrow to optimize compute and storage. Using the MLlib library of PySpark, we trained Word2Vec embeddings of each CCSR code in the training dataset, using surrounding words within a visit as the context windows. The window-size was set to 1 since there were many patient visits that comprised of exactly 1 CCSR code. The resulting embedding vector for any given patient visit was taken to be the mean of the embedding vector of every CCSR word in the sentence to produce a singular 300-dimensional embedding for a visit.
How do the Learned Embeddings Look?
We visualized these embedding vectors to get an understanding of what these represent and if they reveal any information. For this purpose, we attempted 3 different types of visualization approaches:
- PCA
- tSNE
- tSNE on PCA reduced lower dimensional data
The visualizations are shown in the figure below:

Figure: The visualization of the 300 dimensional word2vec learned embeddings using 3 different approaches: (1) PCA (2) tSNE and (3) tSNE on the PCA reduced data since tSNE on 300 dimensional data directly turns out to be overly expensive. The labels represent the 7 different classes for this multiclass classification problem. These labels stand for: Circulatory (0), Gastrointestinal (1), Injury & poisoning (2), Neurologic (3), Other (4), Obstetric (5), and Infectious (6). The obstetric category clearly clusters out because of the reason that only female patients demonstrate such diseases and PCA’s first component captures this gender influence in the diseases even though the embeddings themselves are unaware of the gender information of the patient.
The visualizations were obatined using the code snippet below (borrowed from here):
N = 10000

# ----------------------- PCA----------------
df_subset = df.loc[rndperm[:N],:].copy()
data_subset = df_subset[feat_cols].values

pca = PCA(n_components=3)
pca_result = pca.fit_transform(data_subset)

df_subset['pca-one'] = pca_result[:,0]
df_subset['pca-two'] = pca_result[:,1]
df_subset['pca-three'] = pca_result[:,2]

print('Explained variation per principal component: {}'.format(pca.explained_variance_ratio_))

# --------------------- tSNE------------------
time_start = time.time()
tsne = TSNE(n_components=2, verbose=1, perplexity=40, n_iter=300)
tsne_results = tsne.fit_transform(data_subset)
print('t-SNE done! Time elapsed: {} seconds'.format(time.time()-time_start))

df_subset['tsne-2d-one'] = tsne_results[:,0]
df_subset['tsne-2d-two'] = tsne_results[:,1]

# ----------- tSNE on PCA redudced data-------
pca_50 = PCA(n_components=50)
pca_result_50 = pca_50.fit_transform(data_subset)
print('Cumulative explained variation for 50 principal components: {}'\
	.format(np.sum(pca_50.explained_variance_ratio_)))

time_start = time.time()tsne = TSNE(n_components=2, verbose=0, perplexity=40, n_iter=300)
tsne_pca_results = tsne.fit_transform(pca_result_50)
print('t-SNE done! Time elapsed: {} seconds'.format(time.time()-time_start))

df_subset['tsne-pca50-one'] = tsne_pca_results[:,0]
df_subset['tsne-pca50-two'] = tsne_pca_results[:,1]
Note: To get a final embedding vector for each visit, we concatenate the one-hot vector encoding of ‘Sex’, ‘Race’, and the integer encoding of ‘Age’, with the embedding for the ICD-10 codes to produce a 1x311 embedding vector for each visit, which is then fed into our model.
How Good do the Results Look?
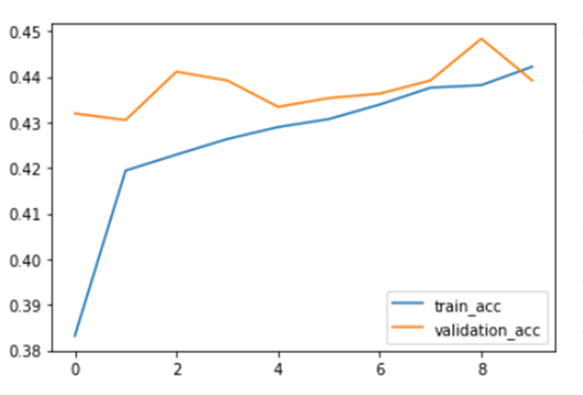
The predictive LSTM based multiclass classification model that uses the above learned word2vec embeddings was early stopped at 10 epochs. Train and Validation accuracy can also be seen below.
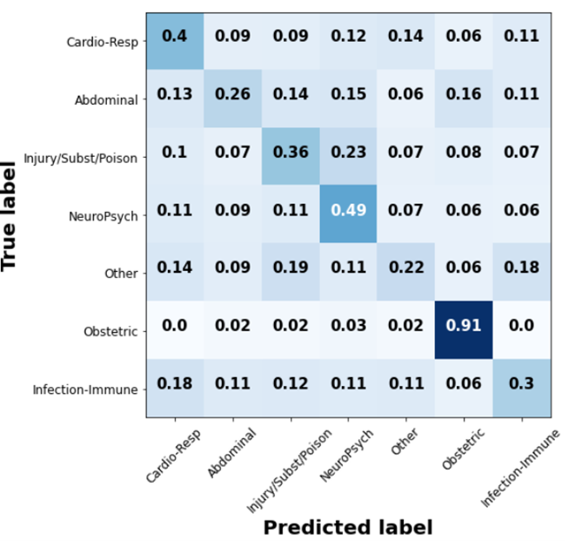
The confusion matrix for Word2Vec can be found in the figure below.
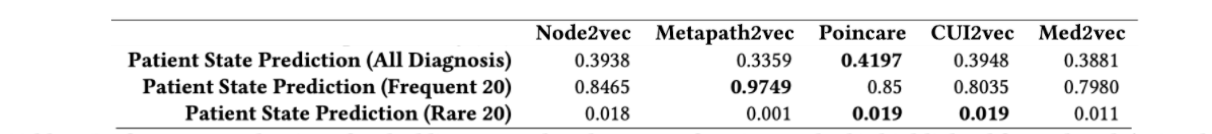
Word2Vec embeddings were able to achieve a test accuracy of 0.42, which is comparable to the state of the art1 as seen the table below (see Poincare accuracy that is bolded. The first row is the relevant one for the task at hand. The columns in the table represent the different embedding strategies)1.
Future work
The work illustrated here is part of an ongoing project. The key takeaway is the Word2vec approach for embedding information in patient visits with carefully designed learning protocol for the embeddings can match state of the art methods in terms of predictive accuracy for clinically relevant tasks such as future ER visit category.
Currently, the problem is structured in a way that the model learns from a pair of historic visits to predict on the third visit. It will be valuable to notice the effect of changing the number of historic samples used for training, i.e. we can investigate how the model performs if instead of 2, it learns from 3, or 4, or 5 previous visits. We can incorporate an attention mechanism2 to get a better grasp of what features get activated the most for which predictions. In future, we could consider using a more limited problem to determine which embedding strategies are preferred for specific prediction tasks. We could also expand the set of embedding candidates and implement different graph based embedding strategies.
-
Khushbu Agarwal, Tome Eftimov, Raghavendra Addanki, Sutanay Choudhury, Suzanne Tamang, Robert Rallo: “Snomed2Vec: Random Walk and Poincaré Embeddings of a Clinical Knowledge Base for Healthcare Analytics”, 2019; arXiv:1907.08650. ↩ ↩2
-
Kim, David; Cogill, Steven; Hsia, Renee; Yang, Samuel. Deep learning for the primary prevention of non-accidental trauma. 2020. Pre-print in submission to Annals of Emergency Medicine. ↩