s_chromaticSpatialChart
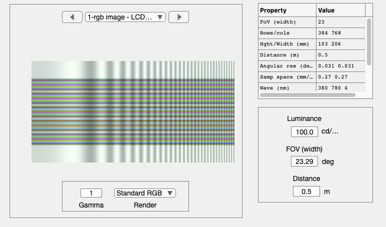
Make a chart that varies in color down the rows and spatial frequency
across the columns.
The parameters are at the top.
There are various interesting perceptual effects.
Make a sweep frequency across the rows
If you walk about 3-5 m from the screen, you no longer see the
color variation down the rows.
See also
Contents
Parameters
nRows = 256;
nCols = 3*nRows;
maxFreq = 30;
cWeights = [0.3, 0.7, 1];     % General color appearance is controlled
cFreq    = [1, 1.5, 2]*10;    % Causes the color variation.  Change the 10
cPhase   = [0, 0, 0]*pi;      % Freq differences are enough
RGB channels
rSamples = 0:(nRows-1);
r = cWeights(1)*cos(2*pi*cFreq(1)*rSamples/nRows + cPhase(1)) + 2;
g = cWeights(2)*cos(2*pi*cFreq(2)*rSamples/nRows + cPhase(2)) + 2;
b = cWeights(3)*cos(2*pi*cFreq(3)*rSamples/nRows + cPhase(3)) + 2;
% ieNewGraphWin; plot(rSamples,r,'r-',rSamples,g,'g-',rSamples,b,'b-')
Spatial modulation
img = imgSweep(nCols, maxFreq);
img = img / max(img(:)) + 2;
img = img(1,:);
Build up the rgb image
RGB = zeros(nRows,nCols,3);
RGB(:,:,1) = (r(:) * img(:)');
RGB(:,:,2) = (g(:) * img(:)');
RGB(:,:,3) = (b(:) * img(:)');
RGB = RGB/max(RGB(:));
The white border
w = zeros(nRows/4,1) + 0.5;
W = zeros(nRows/4,nCols,3);
tmp = (w(:)*img(:)');
for ii=1:3
    W(:,:,ii) = tmp;
end
W = W/max(W(:));

% RGB = [W ; RGB; W; RGB; W];
RGB = [W; RGB; W];
%
% ieNewGraphWin;
% image(RGB)
% truesize
Make the scene and show it
scene = sceneFromFile(RGB,'rgb',100,'LCD-Apple');
sceneWindow(scene);