Illustrate sRGB gamut for natural and synthetic surfaces
The parameters of an srgb display can be returned with this function
In this script we load surfaces that are stored in
iset/data/surfaces/reflectances
directory and then calculate the XYZ values of these surfaces when they are illuminated by a D65 illuminant.
We convert the XYZ values into sRGB values and plot them as a 3D graph. To the extent the points fall within the unit cube, the data could be displayed on a sRGB display
See also: xySRGB = srgbParameters('val','chromaticity') adobeSRGB = adobergbParameters('val','chromaticity')
Contents
Initialize
ieInit;

wave = 400:10:700;

% Store up the sRGB and Adobe RGB chromaticity parameters for plotting the
% chromaticities, later
srgbxy = srgbParameters('val','chromaticity');
srgbxy = cat(2,srgbxy,srgbxy(:,1));

adobergbxy = adobergbParameters('val','chromaticity');
adobergbxy = cat(2,adobergbxy,adobergbxy(:,1));
Load many natural surfaces
sFiles{1} = which('Nature_Vhrel.mat');
sFiles{2} = which('Objects_Vhrel.mat');
sFiles{3} = which('Food_Vhrel.mat');
sFiles{4} = which('Clothes_Vhrel.mat');
sFiles{5} = which('Hair_Vhrel.mat');
%{
sFiles{1} = fullfile(isetRootPath,'data','surfaces','reflectances','Nature_Vhrel.mat');
sFiles{2} = fullfile(isetRootPath,'data','surfaces','reflectances','Objects_Vhrel.mat');
sFiles{3} = fullfile(isetRootPath,'data','surfaces','reflectances','Food_Vhrel.mat');
sFiles{4} = fullfile(isetRootPath,'data','surfaces','reflectances','Clothes_Vhrel.mat');
sFiles{5} = fullfile(isetRootPath,'data','surfaces','reflectances','Hair_Vhrel.mat');
%}
% To see how many samples in each of the files, you can do this
% foo = load(sFiles{5});
% size(foo.data,2)
sSamples = {1:79,1:170,1:27,1:41,1:7};
pSize = 32;
grayFlag = 1; % Add a gray strip, why not
% To make a scene chart ....
% [scene, sampleList, reflectances, rcSize] = ...
% sceneReflectanceChart(sFiles,sSamples,pSize,[wave],[grayFlag=1],[sampling])
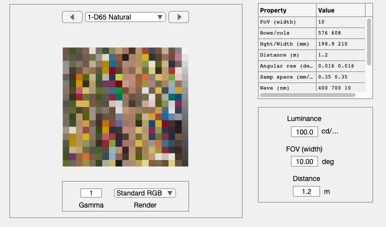
[scene, ~, reflectances] = sceneReflectanceChart(sFiles,sSamples,pSize,wave, grayFlag);
scene = sceneSet(scene,'name','D65 Natural');
scene = sceneAdjustIlluminant(scene,'D65.mat');
ieAddObject(scene); sceneWindow;
Calculate out the XYZ
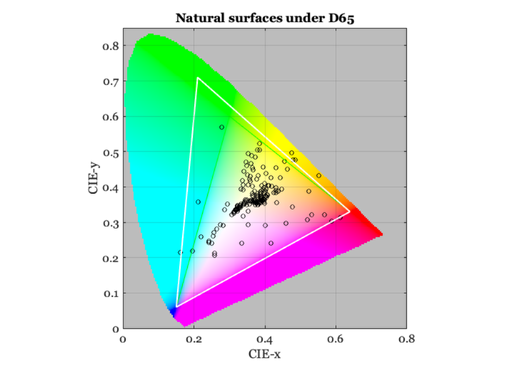
% Calculate the radiance energy from the scene points
light = sceneGet(scene,'illuminant energy');
E = diag(light)*reflectances;

% Convert to XYZ
XYZ = ieXYZFromEnergy(E',wave);
XYZ = XW2RGBFormat(XYZ,size(XYZ,1),1);

% Plot the chromaticity and the two gamuts
chromaticityPlot(chromaticity(XYZ));
line(srgbxy(1,:),srgbxy(2,:),'linewidth',1)
line(adobergbxy(1,:),adobergbxy(2,:),'color','white','linewidth',2);
title('Natural surfaces under D65')

% vcNewGraphWin;
% subplot(1,2,1), plot(wave,light); grid on; xlabel('Wavelength (nm)');
% subplot(1,2,2), plot(wave,reflectances); grid on; xlabel('Wavelength (nm)');
Have a look at the objects under a yellow light (tungsten)
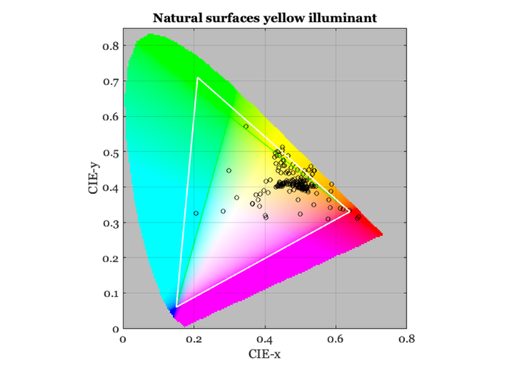
% Adjust
light = blackbody(wave,3000);
scene = sceneAdjustIlluminant(scene,light);
scene = sceneSet(scene,'name','Yellow Natural');
ieAddObject(scene); sceneWindow;

E = diag(light)*reflectances;
XYZ = ieXYZFromEnergy(E',wave);
XYZ = XW2RGBFormat(XYZ,size(XYZ,1),1);

% Plot chromaticity and gamuts
chromaticityPlot(chromaticity(XYZ));
line(srgbxy(1,:),srgbxy(2,:),'linewidth',1)
line(adobergbxy(1,:),adobergbxy(2,:),'color','white','linewidth',2);

title('Natural surfaces yellow illuminant')

% vcNewGraphWin;
% subplot(1,2,1), plot(wave,light); grid on; xlabel('Wavelength (nm)');
% subplot(1,2,2), plot(wave,reflectances); grid on; xlabel('Wavelength (nm)');

Load all the synthetic surfaces
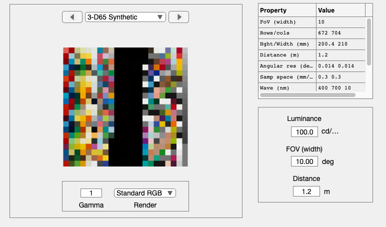
clear sFiles
sFiles{1} = which('DupontPaintChip_Vhrel.mat');
sFiles{2} = which('MunsellSamples_Vhrel.mat');
sFiles{3} = which('esserChart.mat');
sFiles{4} = which('gretagDigitalColorSG.mat');

%{
sFiles{1} = fullfile(isetRootPath,'data','surfaces','reflectances','DupontPaintChip_Vhrel.mat');
sFiles{2} = fullfile(isetRootPath,'data','surfaces','reflectances','MunsellSamples_Vhrel.mat');
sFiles{3} = fullfile(isetRootPath,'data','surfaces','reflectances','esserChart.mat');
sFiles{4} = fullfile(isetRootPath,'data','surfaces','reflectances','gretagDigitalColorSG.mat');
%}
sSamples  = {1:120,1:64,1:113,1:140};
pSize = 32;
grayFlag = 1;   % Add a gray strip, why not

%   [scene, sampleList, reflectances, rcSize] = ...
%      sceneReflectanceChart(sFiles,sSamples,pSize,[wave],[grayFlag=1],[sampling])
[scene, sampleList, reflectances] = sceneReflectanceChart(sFiles,sSamples,pSize,wave, grayFlag);
scene = sceneSet(scene,'name','D65 Synthetic');
scene = sceneAdjustIlluminant(scene,'D65.mat');
ieAddObject(scene); sceneWindow;
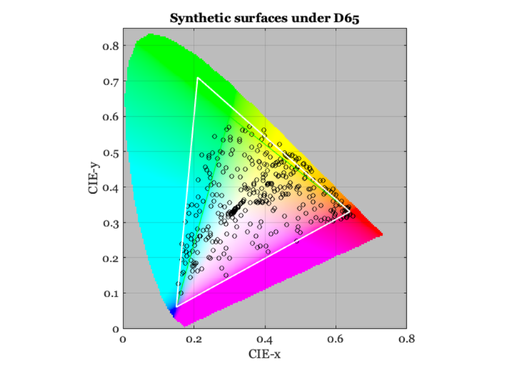
Synthetic surfaces under D65 on chromaticity plot
light = sceneGet(scene,'illuminant energy');
E = diag(light)*reflectances;
XYZ = ieXYZFromEnergy(E',wave);
XYZ = XW2RGBFormat(XYZ,size(XYZ,1),1);

chromaticityPlot(chromaticity(XYZ));
line(srgbxy(1,:),srgbxy(2,:),'linewidth',1)
line(adobergbxy(1,:),adobergbxy(2,:),'color','white','linewidth',2);
title('Synthetic surfaces under D65')

%{
 ieNewGraphWin([],'wide');
 subplot(1,2,1), plot(wave,light); grid on; xlabel('Wavelength (nm)');
 subplot(1,2,2), plot(wave,reflectances); grid on; xlabel('Wavelength (nm)');
%}