s_humanDisplayPSF
Compute the point spread in each of the cone classes from each of the display primaries.
This script may become the basis for calculating (efficiently) from a video
NOTE: With Matlab 2020a this script produced Matlab Graphics Error notices. Twice.
NOTE: Come back to here and figure out what the issue is with the OTF at the end.
See also oiCreate;
Contents
- Create a display and human optics (Marimont and Wandell model)
- We will loop on these when we are ready
- Make a point image on the display
- Compute OI
- Make a high resolution cone sampling array
- Plot
- Now show the white point spread, just as an illustration
- Plot the volts
- This OTF has the unwanted ringing in the x/y directions..
- END
ieInit
Create a display and human optics (Marimont and Wandell model)
d = displayCreate;
% oi = oiCreate('diffraction limited');
% oi = oiCreate('human mw');
oi = oiCreate('wvf');
We will loop on these when we are ready
coneType  = 3;  % K,L,M,S
pixelType = 2;  % R,G,B
Make a point image on the display
% Something wrong here.  There is a point in the lower right corner for
% some reason.
r = 51;
img = zeros(r,r,3);
img((r+1)/2,(r+1)/2,pixelType) = 1;

%{
 ieNewGraphWin; imagesc(img)
%}

pointScene = sceneFromFile(img,'rgb',[],d);
% pointScene = sceneSet(pointScene,'distance',10);
sceneWindow(pointScene);
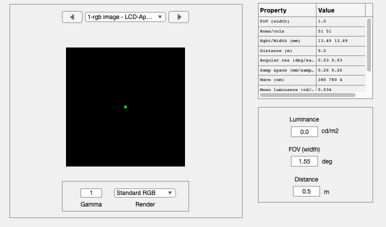
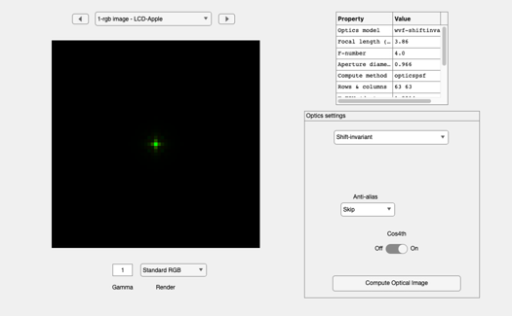
Compute OI
oi = oiCompute(oi,pointScene);
oiWindow(oi);
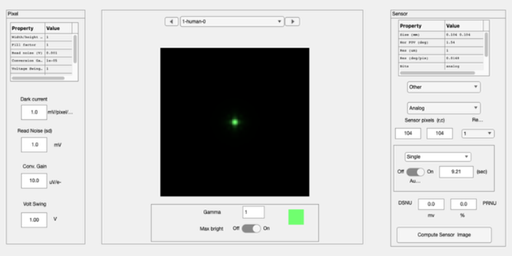
Make a high resolution cone sampling array
% We will calculate the cone responses at 0.25um and then build the OTF
params.sz = [128,128];              % Square array
params.coneAperture = [1 1]*1e-6; % In meters

% Choose the cone type
dens = zeros(1,4);
dens(coneType) = 1;
params.rgbDensities = dens; % Empty, L,M,S

pixel = [];
sensor = sensorCreate('human',pixel,params);
sensor = sensorSet(sensor,'fov',sceneGet(pointScene,'fov'),oi);
sensor = sensorSet(sensor,'noise flag',0);
sensor = sensorCompute(sensor,oi);

sensorWindow(sensor);
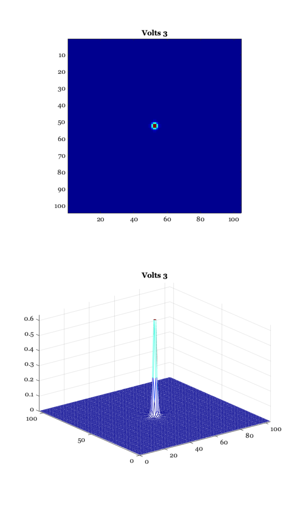
Plot
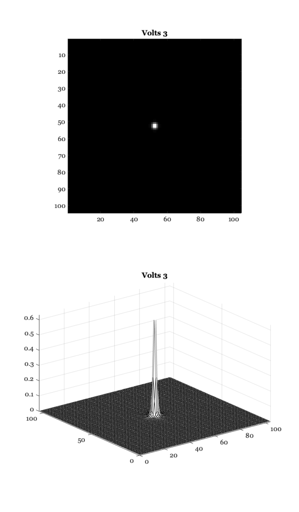
v = sensorGet(sensor,'volts',coneType);  % Get the right cone type

ieNewGraphWin([],'tall');

subplot(2,1,1)
sz = sensorGet(sensor,'size');
v = reshape(v,sz(1),sz(2));
imagesc(v); axis image; colormap(gray(64))
title(sprintf('Volts %d',coneType));

subplot(2,1,2)
mesh(v); colormap(jet(64))
title(sprintf('Volts %d',coneType));
Now show the white point spread, just as an illustration
img((r+1)/2,(r+1)/2,:) = 1;
%{
 ieNewGraphWin; imagesc(img)
%}

pointScene = sceneFromFile(img,'rgb',[],d);
pointScene = sceneSet(pointScene,'distance',10);
oi     = oiCompute(oi,pointScene);
sensor = sensorCompute(sensor,oi);
sensorWindow(sensor);

Plot the volts
v = sensorGet(sensor,'volts',coneType);  % Get the right cone type

ieNewGraphWin([],'tall');

subplot(2,1,1)
sz = sensorGet(sensor,'size');
v = reshape(v,sz(1),sz(2));
imagesc(v); axis image; colormap(gray(64))
title(sprintf('Volts %d',coneType));

subplot(2,1,2)
mesh(v);
title(sprintf('Volts %d',coneType));
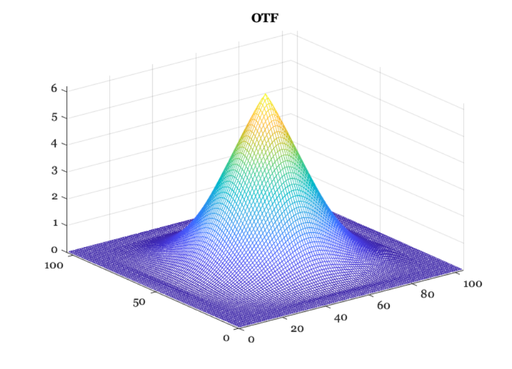
This OTF has the unwanted ringing in the x/y directions..
ieNewGraphWin;
m = getMiddleMatrix(v,127);
otf = psf2otf(m); mesh(fftshift(abs(otf)));
title('OTF');
END
drawnow;