s_opticsPSF2Zcoeffs.m
PSF 2 Wernike Coefficients
Search for the Wernike polynomial coefficients that produce a target PSF.
Note this good Watson tutorial. But it has no units, wavelength, and such.
http://jov.arvojournals.org/article.aspx?articleid=2213266
BW, Vistasoft team, 2018
Contents
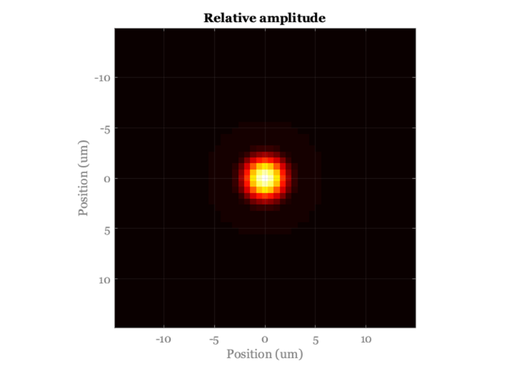
Create a wavefront object with some coefficients
% Create a wvf object
wave = 550;
wvf = wvfCreate('wave',wave);
wvf = wvfSet(wvf,'zcoeffs',.2,'defocus');
wvf = wvfSet(wvf,'zcoeffs',0,'vertical_astigmatism');

wvf = wvfCompute(wvf);

wvfPlot(wvf,'image psf','unit','um','plot range',15);
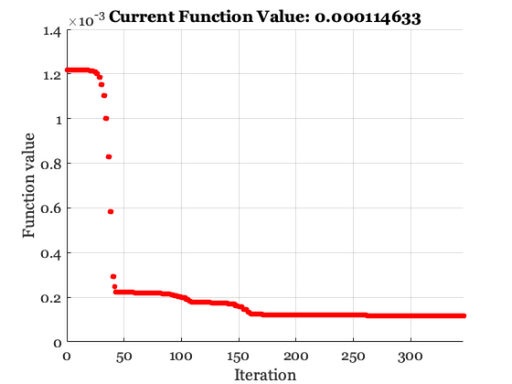
Get the parameters we need for the search
thisWaveUM  = wvfGet(wvf,'wave','um');
thisWaveNM  = wvfGet(wvf,'wave','nm');
pupilSizeMM = wvfGet(wvf,'pupil size','mm');
zpupilDiameterMM = wvfGet(wvf,'z pupil diameter');

pupilPlaneSizeMM = wvfGet(wvf,'pupil plane size','mm',thisWaveNM);
nPixels   = wvfGet(wvf,'spatial samples');
wvf       = wvfCompute(wvf);
psfTarget = wvfGet(wvf,'psf');

% Rewrite this function using the validated methods in wvfComputePSF.
% The current function is a version of that.  Maybe identical, but not
% validated in the same way.
f = @(x) psf2zcoeff(x,psfTarget,pupilSizeMM,zpupilDiameterMM,pupilPlaneSizeMM,thisWaveUM, nPixels);

% I should to figure out how to set the tolerances.  Default is 1e-4
zcoeffs = wvfGet(wvf,'zcoeffs');

% I am searching over the first 6 coefficients.  This includes defocus.
% Could do more, I suppose.  Also, the first coefficient ('piston') has no
% impact on the PSF.  So the search always forces that to 0.
nCoeffs = 6;
zcoeffs(1:nCoeffs)
x0 = zeros(size(zcoeffs(1:nCoeffs)));
options = optimset('PlotFcns',@optimplotfval);

x = fminsearch(f,x0,options);

% Piston comes back as an arbitrary value because the error function
% ignores it. We force it to zero here.
x(1) = 0;
ans =

         0         0         0         0    0.2000         0
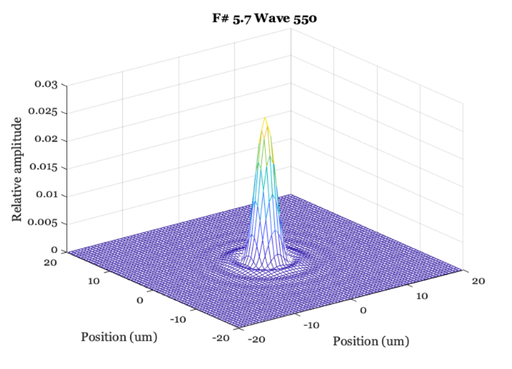
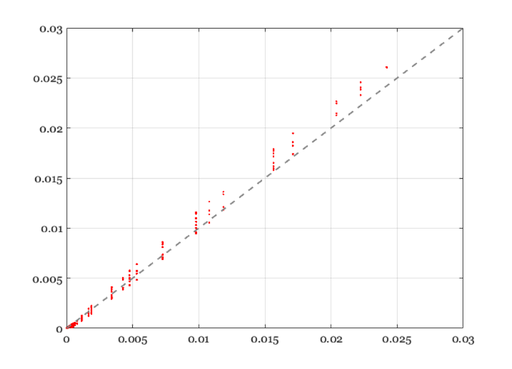
Compare the values
fprintf('Estimated\n'); disp(x)
fprintf('True\n'); disp(zcoeffs(1:nCoeffs))

psf = wvfPlot(wvf,'psf','unit','um','plot range',20);

wvfEst = wvfSet(wvf,'zcoeffs',x);
wvfEst = wvfCompute(wvfEst);
psfEst = wvfPlot(wvfEst,'psf','unit','um','plot range',20);

ieNewGraphWin;
plot(psf.z(:),psfEst.z(:),'.');
identityLine;
Estimated
         0   -0.0107   -0.0018   -0.0006    0.1042    0.0004

True
         0         0         0         0    0.2000         0

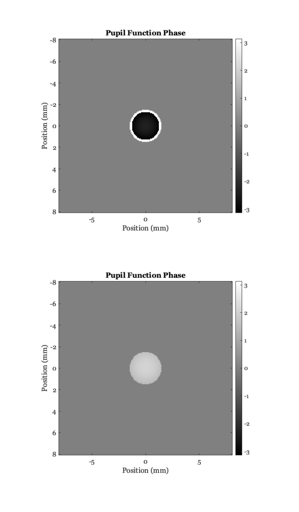
Show the pupil phase functions
ieNewGraphWin([],'tall');
subplot(2,1,1), wvfPlot(wvf,'image pupil phase','unit','mm','wave',wave,'window',false)
subplot(2,1,2), wvfPlot(wvfEst,'image pupil phase','unit','mm','wave',wave,'window',false)
ans =

  struct with fields:

    x: [-8.0657 -7.9850 -7.9044 -7.8237 -7.7430 -7.6624 … ] (1×201 double)
    y: [-8.0657 -7.9850 -7.9044 -7.8237 -7.7430 -7.6624 … ] (1×201 double)
    z: [201×201 double]


ans =

  struct with fields:

    x: [-8.0657 -7.9850 -7.9044 -7.8237 -7.7430 -7.6624 … ] (1×201 double)
    y: [-8.0657 -7.9850 -7.9044 -7.8237 -7.7430 -7.6624 … ] (1×201 double)
    z: [201×201 double]