[Menu] [Previous] [Next]
TUTORIAL: Principles of Tracer Modeling
Kinetic Imaging
Use the "Menu" button to jump to the Let's Play PET Main Menu or click on the Next (right arrowhead) and Previous (left arrowhead) buttons to proceed sequentially through the topics and tutorials. Or, you can return to the Department of Molecular and Medical Pharmacology's Home Page.Contents:
Topics:
Introduction
Kinetic imaging refers to the measurement of tracer uptake over time. An image of tracer activity distribution is a good starting point for obtaining more useful information such as regional blood flow or regional glucose metabolism. The process of taking PET images of radioactivity distribution and then using tracer kinetic modeling to extract useful information is termed image analysis. The tracer kinetic method with radiolabeled compounds is a primary and fundamental principle underlying PET and autoradiography. It has also been essential to the investigation of basic chemical and functional processes in biochemistry, biology, physiology, anatomy, molecular biology and pharmacology. Tracer kinetic methods also form the basis in in vivo imaging studies in nuclear medicine.
Tracer Distribution in Brain over Time

Click on image above to view full-size image.
Let's first look at an example of tracer distribution over time. With our trusting patient on the scanner bed, we'll inject her with a radiolabeled D2 dopaminergic receptor ligand, 18F-labeled fluorethylspiperone (FESP). We will then monitor the temporal sequence of PET scans, following FESP injection, through a plane that contains the striatum (caudate & putamen).

Click on image above to view full-size image.
Initially, the FESP tracer is distributed in plasma component of the brain. Then the ligand enters the tissue in a free state. Finally, at the end of three hours, nearly all of the FESP present in the brain is bound to the striatum, as indicated by the red pixels of the pseudo-color scale used here.
Tracer Distribution in Heart over Time

Click on image above to view full-size image.
Kinetic imaging is also used in cardiology. This sequence shows N-13 ammonia activity images from a PET scanner as the activity distributes itself in the heart and lungs over time. The first sign of activity is in the right ventricle, and then the activity is present in the left ventricle, and finally the activity is seen in the myocardial wall surrounding the left ventricle (the donut of activity). Note also the uptake of N-13 ammonia by the lungs which surround the heart image.

Click on image above to view full-size image.
We will now examine how a tissue time activity curve is obtained from a dynamic study. Shown above is a N-13 ammonia canine myocardial scan acquired over approximately 3 minutes. Each image represents counts that were acquired over 10 seconds, with the last two images representing counts that were acquired over 30-60 seconds. The mid-point time values of the acquisition are listed beneath each image. Note that the activity is primarily in the right ventricle at 25 seconds, and moves into the left ventricle at 35-55 seconds, and then in later images the activity slowly distributes in the myocardial tissue (or wall) surrounding the left ventricle.
ROI Analysis

Click on image above to view full-size image.
A region of interest (ROI), indicated above by the shadowed white outline, can be drawn over a segment of the myocardial wall on the last image (where the heart is well-defined) and then copied to all previous images so that the activity in that segment of the myocardial wall can be tracked over time.
Tissue Curve


Click on one or more of the images above to view full-size image(s).
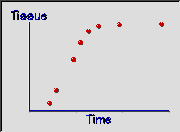
Data obtained through ROI analysis of dynamic images produces a tissue time-activity-curve. This curve represents the counts/second/pixel (or counts/second/ml, if a calibration cylinder scan is available) in a given region as a function of time.
Blood Curve

Click on image above to view full-size image.
Data obtained from an ROI drawn over the left ventricle produces a blood time-activity curve. A biochemical or physiological model can be fitted to the blood curve in conjunction with a regional tissue curve to estimate one or more model parameters (e.g., myocardial blood flow) in that tissue region. The processing of PET images through ROI analysis and time-activity curve fitting with a particular model are a major component of image analysis. This processing of PET images can often be facilitated by semi-automated software packages and can often be fully automated to produce parametric images. These images represent a parameter (e.g., glucose metabolism, blood perfusion) and convey more information than just the distribution of radioactivity in an organ.
[Menu] [Previous] [Next]