


Next: Interpreting the text output
Up: Analyzing the results
Previous: Plots of Ancestry estimates
Contents
We also provide plots of several interesting summary statistics.
[Plotting]
 [Data Plotting] contains time-series plots of
the values of certain summaries during the course of a run. One
example is shown in Figure 7; notice that there is a brief
period at the start of the run where the values increase dramatically
before reaching their stationary distribution. You should inspect
these plots to be sure that the summary statistics seem to stabilize
before the end of the burnin.
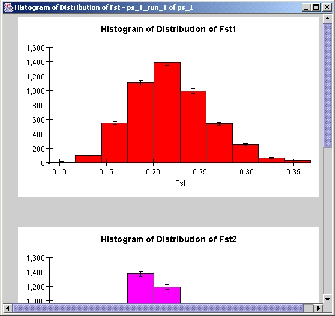
There are also histogram plots of
[Data Plotting] contains time-series plots of
the values of certain summaries during the course of a run. One
example is shown in Figure 7; notice that there is a brief
period at the start of the run where the values increase dramatically
before reaching their stationary distribution. You should inspect
these plots to be sure that the summary statistics seem to stabilize
before the end of the burnin.
There are also histogram plots of  and
and  (Figure
7.7). These are estimates of the posterior distribution of
these parameters.
(Figure
7.7). These are estimates of the posterior distribution of
these parameters.
Figure 11:
The histogram of Fst
 |
William Wen
2002-07-18