


Next: Priors
Up: Running structure from the
Previous: Parameters in file extraparams.
Contents
Output options
- PRINTQHAT (Boolean) When this is turned on, the point
estimate for
 is not only printed into the main results file, but
also into a separate file with suffix ``q''. This file is required
in order to run the companion program STRAT.
is not only printed into the main results file, but
also into a separate file with suffix ``q''. This file is required
in order to run the companion program STRAT.
- UPDATEFREQ (int) Number of MCMC iterations between printing
each update on the screen. Value of 0 will cause this to be set
automatically.
- PRINTLIKES (Boolean) Print the current value of the
likelihood to the screen in every iteration.
- INTERMEDSAVE (int) If you're impatient to see preliminary
results before the end of the run, you can have results printed to
file at intervals during the MCMC run. A total of INTERMEDSAVE such
files are printed, at equal intervals following the completion of the
BURNIN. Turn this off by setting to 0. Names of these files created
using OUTFILE name.
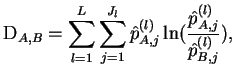
- PRINTKLD (Boolean) Print the ``Kullback-Leibler''
divergence ``D'' between populations. The output to the screen gets a
bit wide for moderate
 , so the user may want to switch this off to
clarify the output.
The distance between populations
, so the user may want to switch this off to
clarify the output.
The distance between populations  and
and  is computed as
 |
(5) |
where
 is the estimated allele frequency of allele
 at locus
  in population , and where
  is the number of
loci, and
is the number of
loci, and  the number of alleles at locus . Notice that
 and
and
 are not, in general the same; however to
save space in printing the running update, we print the
average of these. This measure of divergence can be motivated as
follows. Suppose that we want to infer whether an individual that is
actually from population is from or . Then it is natural
to compute the ratio of the likelihood of their genotype in each
population.
gives the average contribution of a
single genotyped allele to the log-likelihood ratio. Suppose for
example that
are not, in general the same; however to
save space in printing the running update, we print the
average of these. This measure of divergence can be motivated as
follows. Suppose that we want to infer whether an individual that is
actually from population is from or . Then it is natural
to compute the ratio of the likelihood of their genotype in each
population.
gives the average contribution of a
single genotyped allele to the log-likelihood ratio. Suppose for
example that
 . Then by genotyping 10 (diploid)
loci, the expected log-likelihood ratio is 2.0.
provides a natural measure for the strength of evidence for
assignments of individuals.
. Then by genotyping 10 (diploid)
loci, the expected log-likelihood ratio is 2.0.
provides a natural measure for the strength of evidence for
assignments of individuals.
- ECHODATA (Boolean) Print a brief summary of the data set to
the screen and output file. (Prints the beginnings and ends of the
top and bottom lines of the input file to allow the user to check that
it has been read correctly.)
- ANCESTDIST (Boolean) Collect information about the
distribution of for each individual, as well as just estimating
the mean. When this is turned on, the output file includes the left-
and right-hand ends of the probability intervals for each
 .
(A probability interval is the Bayesian analog of a confidence
interval.) The values printed show the middle
.
(A probability interval is the Bayesian analog of a confidence
interval.) The values printed show the middle  of the
probability interval, where
of the
probability interval, where  is a number in the range 0.0 to 1.0
and is set using ANCESTPINT. The distribution of is
estimated by recording the number of hits in each of a number of boxes
between 0 and 1, to form a sort of histogram. The width of these
boxes, which are of equal size, is set using NUMBOXES.
is a number in the range 0.0 to 1.0
and is set using ANCESTPINT. The distribution of is
estimated by recording the number of hits in each of a number of boxes
between 0 and 1, to form a sort of histogram. The width of these
boxes, which are of equal size, is set using NUMBOXES.
Next: Priors
Up: Running structure from the
Previous: Parameters in file extraparams.
Contents
Jonathan Pritchard
2003-07-10