A2-LucasThrockmorton
My first direction
My original field of interest was education, and factors that might contribute to "better" or "more successful" students. To this end, I researched datasets that related high school and college graduation rates, teacher salaries, standardized test scores, teacher ages, and states' incomes from taxes. Below are links to some of these data sets:
Stats on average grade 4 math scores: http://nces.ed.gov/nationsreportcard/naepdata/report.aspx?app=NDE&p=1-MAT-2-20133%2c20113%2c20093%2c20073%2c20053%2c20033%2c20003%2c20002%2c19963%2c19962%2c19922%2c19902-MRPCM-TOTAL-NP%2cAL%2cAK%2cAZ%2cAR%2cCA%2cCO%2cCT%2cDE%2cDC%2cFL%2cGA%2cHI%2cID%2cIL%2cIN%2cIA%2cKS%2cKY%2cLA%2cME%2cMD%2cMA%2cMI%2cMN%2cMS%2cMO%2cMT%2cNE%2cNV%2cNH%2cNJ%2cNM%2cNY%2cNC%2cND%2cOH%2cOK%2cOR%2cPA%2cRI%2cSC%2cSD%2cTN%2cTX%2cUT%2cVT%2cVA%2cWA%2cWV%2cWI%2cWY%2cDS-MN_MN-Y_J-0-0-37 high school grad rates: http://www.governing.com/gov-data/education-data/state-high-school-graduation-rates-by-race-ethnicity.html college attainment by state: http://www.ed.gov/news/press-releases/new-state-state-college-attainment-numbers-show-progress-toward-2020-goal tax rates: https://wallethub.com/edu/best-worst-states-to-be-a-taxpayer/2416/
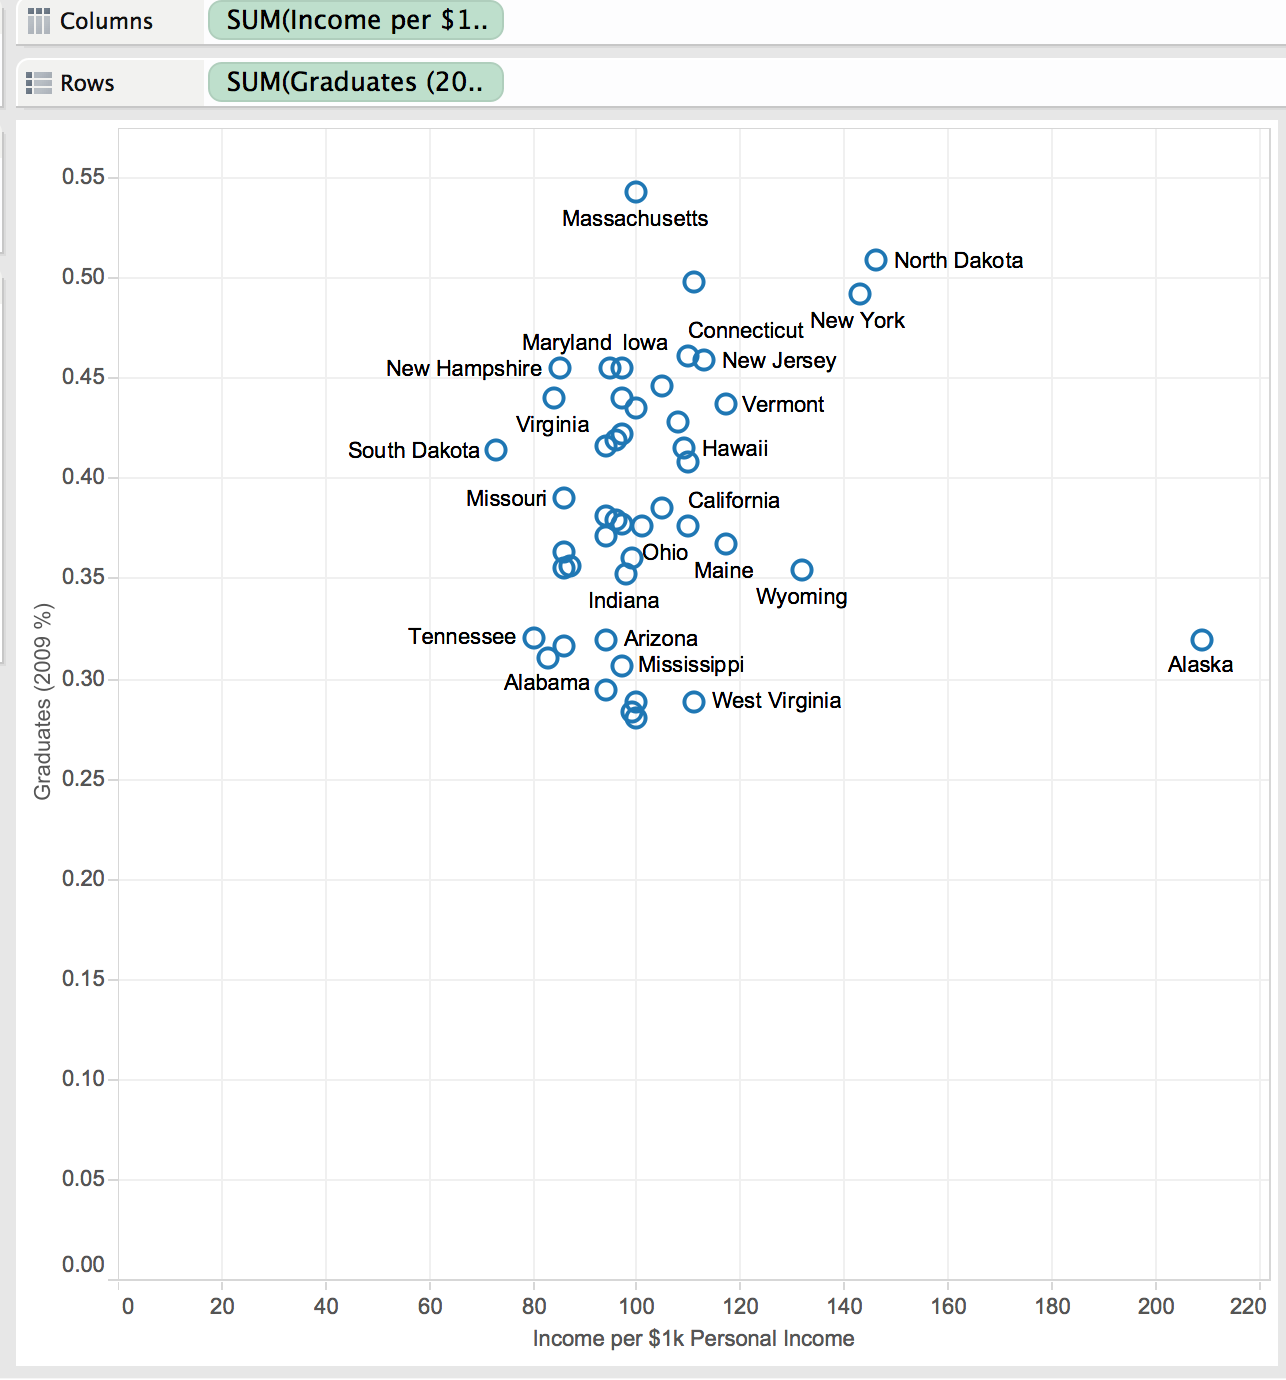
However, after running through many combinations of data, I was generally unable to find strong correlations capable of answering my question in a strong manner. If anything, my results suggested that there is no correlation between tax rates or teacher salaries and student success. One such visualization is below (note that the x axis would be more appropriately named "State tax income per $1k citizens' personal income":
There was, however, a single promising graph, but after reflection I realized it was a tad misleading. Below, you can see that there is indeed a correlation between states' income from taxes per capita and graduation rates. However, in reality, it is likely that graduation rates increase overall population income, and therefore also increase the total sums taxed.
As a result, I decided that, rather than looking at total graduates in a state, I should find a statistic more specific to students CURRENTLY at college, who would not affect state income levels. To do this, I examined the percent of graduating high school students enrolling in college: http://www.higheredinfo.org/dbrowser/index.php?submeasure=63&year=2004&level=nation&mode=data&state=0
However, this returned me to my original finding that there is little visible correlation between taxing or teacher salaries and students who try to go on to college. At this point, I thought it would be wise to pursue a new topic.
A significant pivot
At this point, I decided to look at other topics altogether. Over the last few weeks I’ve seen some visualizations on men and women’s roles in movies a lot on social media, and they have really captured my interest. However, the visualizations only ever showed a zoomed out view of all movies of all time, without any look at how the roles of men and women have changed over time. I became curious: what kind of progress are we making? Is it possible that we’re slowly getting better, and that women are getting increasingly visible roles? Or are we making little progress despite the general belief that society is making strides forwards?
For some background, here is the original article I read, with some cool visualizations: http://polygraph.cool/films/index.html The two sets of data I used were the two from this git repo: https://github.com/matthewfdaniels/scripts/
This time around, I quickly found a visualization that I liked. I played with several different display types (in particular I thought I was going to use 100% stacked bars, but switched to an area line chart), but the variables I wanted to measure were clear and never needed changing: I wanted to graph the percentage of male and female lines as a function of time. To expand on my visualization, I looked hard to find data on the race/ethnicity of all characters as well, but even IMDB doesn’t seem to have info on race of characters or actors that could be scraped. Still, in the end, I was quite pleased with the graphic, and I feel it's not necessary to seek out additional data sources given it's current state:
For this visualization, I created two graphs (both of the line charts) in Tableau using the same axis. I then took the images and edited them in power point to overlay them, as well as to add in a time line.
As the title states, I graph films' distributions of movie lines (by number of words spoken) between men and women. For every year, I combine all words spoken in all movies, and assign a percentage to men and women based on this total. Furthermore, to curve out the line somewhat, I include a second pink line that marks the same statistics, just over 5 year buckets rather than 1 year buckets. I believe that the 1 year buckets provide an important degree of granularity, but that the addition of this 5 year bucket line makes it easier to pick out general trends. Additionally, I use a dark gray line at the 50% mark for two purposes. First, it mark the ideal spotlight split of 50/50 between male and female actors. Second, it serves as a timeline, which I use to mark notable events that occur around spikes and peaks in the graph.
This graph effectively answers my original question of "Are we making progress towards equal screen time (or lines) for women?" with "yes, but slowly". Thanks to the 5-year line, we see a general upward curve over the last 20-30 years. However, it also shows that there was actually a time when we did better than we are now. Seeing this, as a viewer, I immediately asked "why did this happen?", to which the additional timeline hopefully offers some explanation. Though the Equal Pay and Civil Rights Acts may not have directly forced the industry to shift it's behavior, it is still true that the period between 1960 and 1966 was a time of great change for women in the work place, and this general environment may have spurred more dominant female characters in the films at the time.


