Now, repeat this for groups that have uniform (unclustered) data distributions over a whole range of values.
Make a “character” representation of the distance between the 20 locations in the dune data from the vegan package using the function symnum.
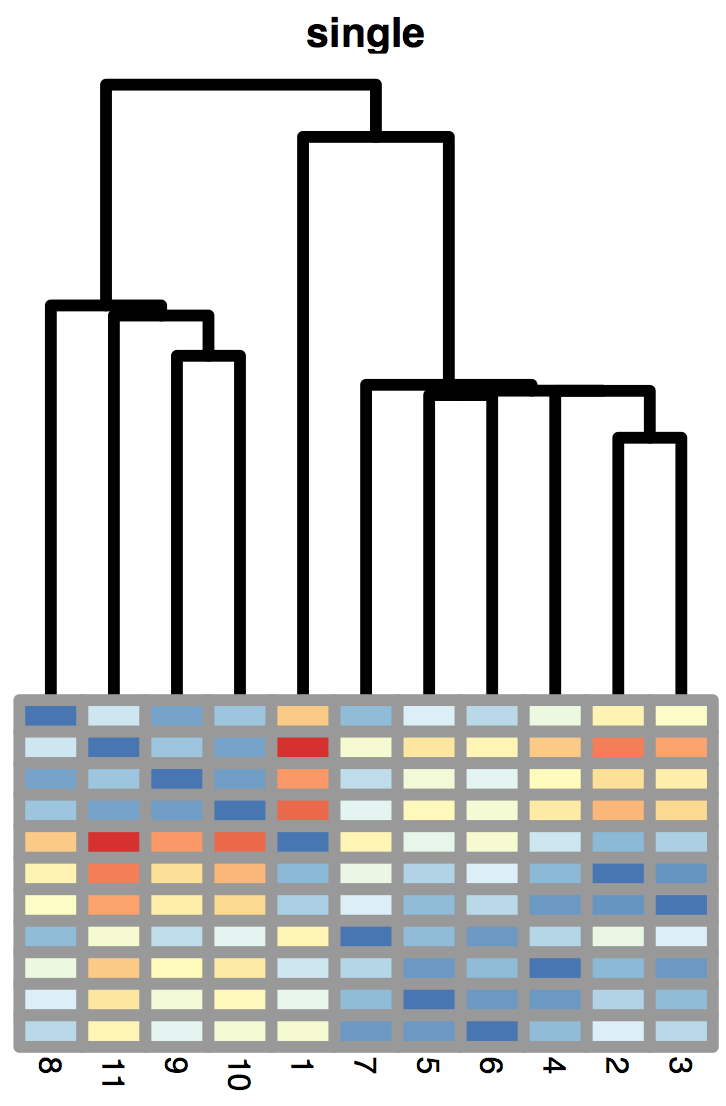
Make a heatmap plot of these distances.
Looking at graphical representations in simple two-dimensional maps can often reveal important clumping patterns. We saw an example for this with the map that enabled Snow to discover the source of the London cholera outbreak. Such clusterings can often indicate important information about hidden variables acting on the observations. Look at a map for breast cancer incidence in the US at:
http://www.huffingtonpost.com/bill-davenhall/post_1663_b_817254.html (Mandal et al. 2009); the areas of high incidence seem spatially clustered. Can you guess the reason(s) for this clustering and high incidence rates on the West and East coasts and around Chicago?
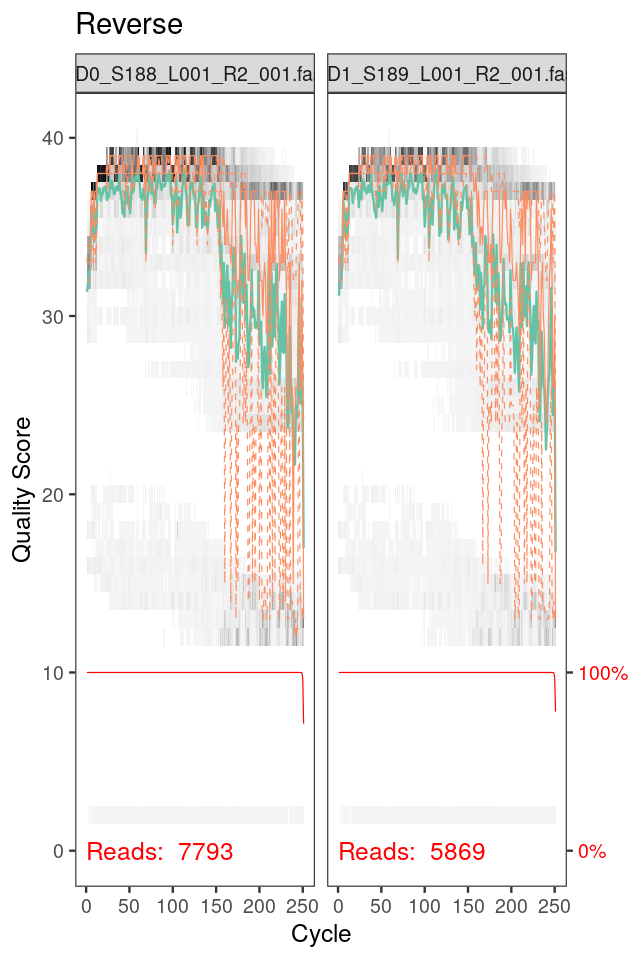
We will need to filter out low-quality reads and trim them to a consistent length. While generally recommended filtering and trimming parameters serve as a starting point, no two datasets are identical and therefore it is always worth inspecting the quality of the data before proceeding. We show the sequence quality plots for the two first samples in Figure 5.36. They are generated by:
Note that we also see the background distribution of quality scores at each position in Figure 5.36 as a grey-scale heat map. The dark colors correspond to higher frequency.
Generate similar plots for four randomly selected sets of forward and reverse reads. Compare forward and reverse read qualities; what do you notice?
Here, the forward reads maintain high quality throughout, while the quality of the reverse reads drops significantly at about position 160. Therefore, we truncate the forward reads at position 240, and trimm the first 10 nucleotides as these positions are of lower quality. The reverse reads are trimmed at position 160. Combine these trimming parameters with standard filtering parameters remember to enforce a maximum of 2 expected errors per-read. (Hint: Trim and filter on paired reads jointly, i.e., both reads must pass the filter for the pair to pass. The input arguments should be chosen following the dada2 vignette carefully. We recommend filtering out all reads with any ambiguous nucleotides.)
Aure, Miriam Ragle, Valeria Vitelli, Sandra Jernström, Surendra Kumar, Marit Krohn, Eldri U Due, Tonje Husby Haukaas, et al. 2017. “Integrative Clustering Reveals a Novel Split in the Luminal A Subtype of Breast Cancer with Impact on Outcome.” Breast Cancer Research 19 (1): 44.
Bendall, Sean C, Garry P Nolan, Mario Roederer, and Pratip K Chattopadhyay. 2012. “A Deep Profiler’s Guide to Cytometry.” Trends in Immunology 33 (7): 323–32.
Callahan, Ben J, Kris Sankaran, Julia A Fukuyama, Paul J McMurdie, and Susan P Holmes. 2016. “Bioconductor Workflow for Microbiome Data Analysis: From Raw Reads to Community Analyses.” F1000Research 5.
Callahan, Benjamin J, Paul J McMurdie, and Susan P Holmes. 2017. “Exact Sequence Variants Should Replace Operational Taxonomic Units in Marker Gene Data Analysis.” ISME Journal, 1–5.
Callahan, Benjamin J, Paul J McMurdie, Michael J Rosen, Andrew W Han, Amy J Johnson, and Susan P Holmes. 2016. “DADA2: High Resolution Sample Inference from Amplicon Data.” Nature Methods, 1–4.
Caporaso, J. G., J. Kuczynski, J. Stombaugh, K. Bittinger, F. D. Bushman, E. K. Costello, N. Fierer, et al. 2010. “QIIME Allows Analysis of High-Throughput Community Sequencing Data.” Nature Methods 7 (5): 335–36.
Chakerian, John, and Susan Holmes. 2012. “Computational Tools for Evaluating Phylogenetic and Hierarchical Clustering Trees.” Journal of Computational and Graphical Statistics 21 (3): 581–99.
Diday, Edwin, and M Paula Brito. 1989. “Symbolic Cluster Analysis.” In Conceptual and Numerical Analysis of Data, 45–84. Springer.
Dundar, Murat, Ferit Akova, Halid Z. Yerebakan, and Bartek Rajwa. 2014.
“A Non-Parametric Bayesian Model for Joint Cell Clustering and Cluster Matching: Identification of Anomalous Sample Phenotypes with Random Effects.” BMC Bioinformatics 15 (1): 1–15.
https://doi.org/10.1186/1471-2105-15-314.
Freedman, David A. 1991. “Statistical Models and Shoe Leather.” Sociological Methodology 21 (2): 291–313.
Hallett, Robin M, Anna Dvorkin-Gheva, Anita Bane, and John A Hassell. 2012. “A Gene Signature for Predicting Outcome in Patients with Basal-Like Breast Cancer.” Scientific Reports 2.
Holmes, Susan, Michael He, Tong Xu, and Peter P Lee. 2005. “Memory t Cells Have Gene Expression Patterns Intermediate Between Naive and Effector.” PNAS 102 (15): 5519–23.
Hornik, Kurt. 2005. “A CLUE for CLUster Ensembles.” Journal of Statistical Software 14 (12).
Hulett, Henry R, William A Bonner, Janet Barrett, and Leonard A Herzenberg. 1969. “Cell Sorting: Automated Separation of Mammalian Cells as a Function of Intracellular Fluorescence.” Science 166 (3906): 747–49.
Kahneman, Daniel. 2011. Thinking, Fast and Slow. Macmillan.
Kaufman, Leonard, and Peter J Rousseeuw. 2009. Finding Groups in Data: An Introduction to Cluster Analysis. Vol. 344. John Wiley & Sons.
Kozich, James J, Sarah L Westcott, Nielson T Baxter, Sarah K Highlander, and Patrick D Schloss. 2013. “Development of a Dual-Index Sequencing Strategy and Curation Pipeline for Analyzing Amplicon Sequence Data on the MiSeq Illumina Sequencing Platform.” Applied and Environmental Microbiology 79 (17): 5112–20.
Mandal, Rakesh, Sophie St-Hilaire, John G Kie, and DeWayne Derryberry. 2009. “Spatial Trends of Breast and Prostate Cancers in the United States Between 2000 and 2005.” International Journal of Health Geographics 8 (1): 53.
McLachlan, Geoffrey, and Thriyambakam Krishnan. 2007. The EM Algorithm and Extensions. Vol. 382. John Wiley & Sons.
Müllner, Daniel. 2013. “Fastcluster: Fast Hierarchical, Agglomerative Clustering Routines for r and Python.” Journal of Statistical Software 53 (9): 1–18.
O’Neill, Kieran, Nima Aghaeepour, Josef Špidlen, and Ryan Brinkman. 2013. “Flow Cytometry Bioinformatics.” PLoS Computational Biology 9 (12): e1003365.
Ohnishi, Y., W. Huber, A. Tsumura, M. Kang, P. Xenopoulos, K. Kurimoto, A. K. Oles, et al. 2014. “Cell-to-Cell Expression Variability Followed by Signal Reinforcement Progressively Segregates Early Mouse Lineages.” Nature Cell Biology 16 (1): 27–37.
Rosen, Michael J, Benjamin J Callahan, Daniel S Fisher, and Susan P Holmes. 2012. “Denoising PCR-Amplified Metagenome Data.” BMC Bioinformatics 13 (1): 283.
Schloss, P D, S L Westcott, T Ryabin, J R Hall, M Hartmann, E B Hollister, R A Lesniewski, et al. 2009. “Introducing mothur: Open-Source, Platform-Independent, Community-Supported Software for Describing and Comparing Microbial Communities.” Applied and Environmental Microbiology 75 (23): 7537–41.
Schloss, P. D., A. M. Schuber, J. P. Zackular, K. D. Iverson, Young V. B., and Petrosino J. F. 2012. “Stabilization of the Murine Gut Microbiome Following Weaning.” Gut Microbes 3 (4): 383–93.
Tibshirani, Robert, Guenther Walther, and Trevor Hastie. 2001. “Estimating the Number of Clusters in a Data Set via the Gap Statistic.” JRSSB 63 (2): 411–23.
Tseng, George C, and Wing H Wong. 2005. “Tight Clustering: A Resampling-Based Approach for Identifying Stable and Tight Patterns in Data.” Biometrics 61 (1): 10–16.
Tversky, Amos, and Daniel Kahneman. 1974. “Heuristics and Biases: Judgement Under Uncertainty.” Science 185: 1124–30.
———. 1975. “Judgment Under Uncertainty: Heuristics and Biases.” In Utility, Probability, and Human Decision Making, 141–62. Springer.