
|
|
|
|
|


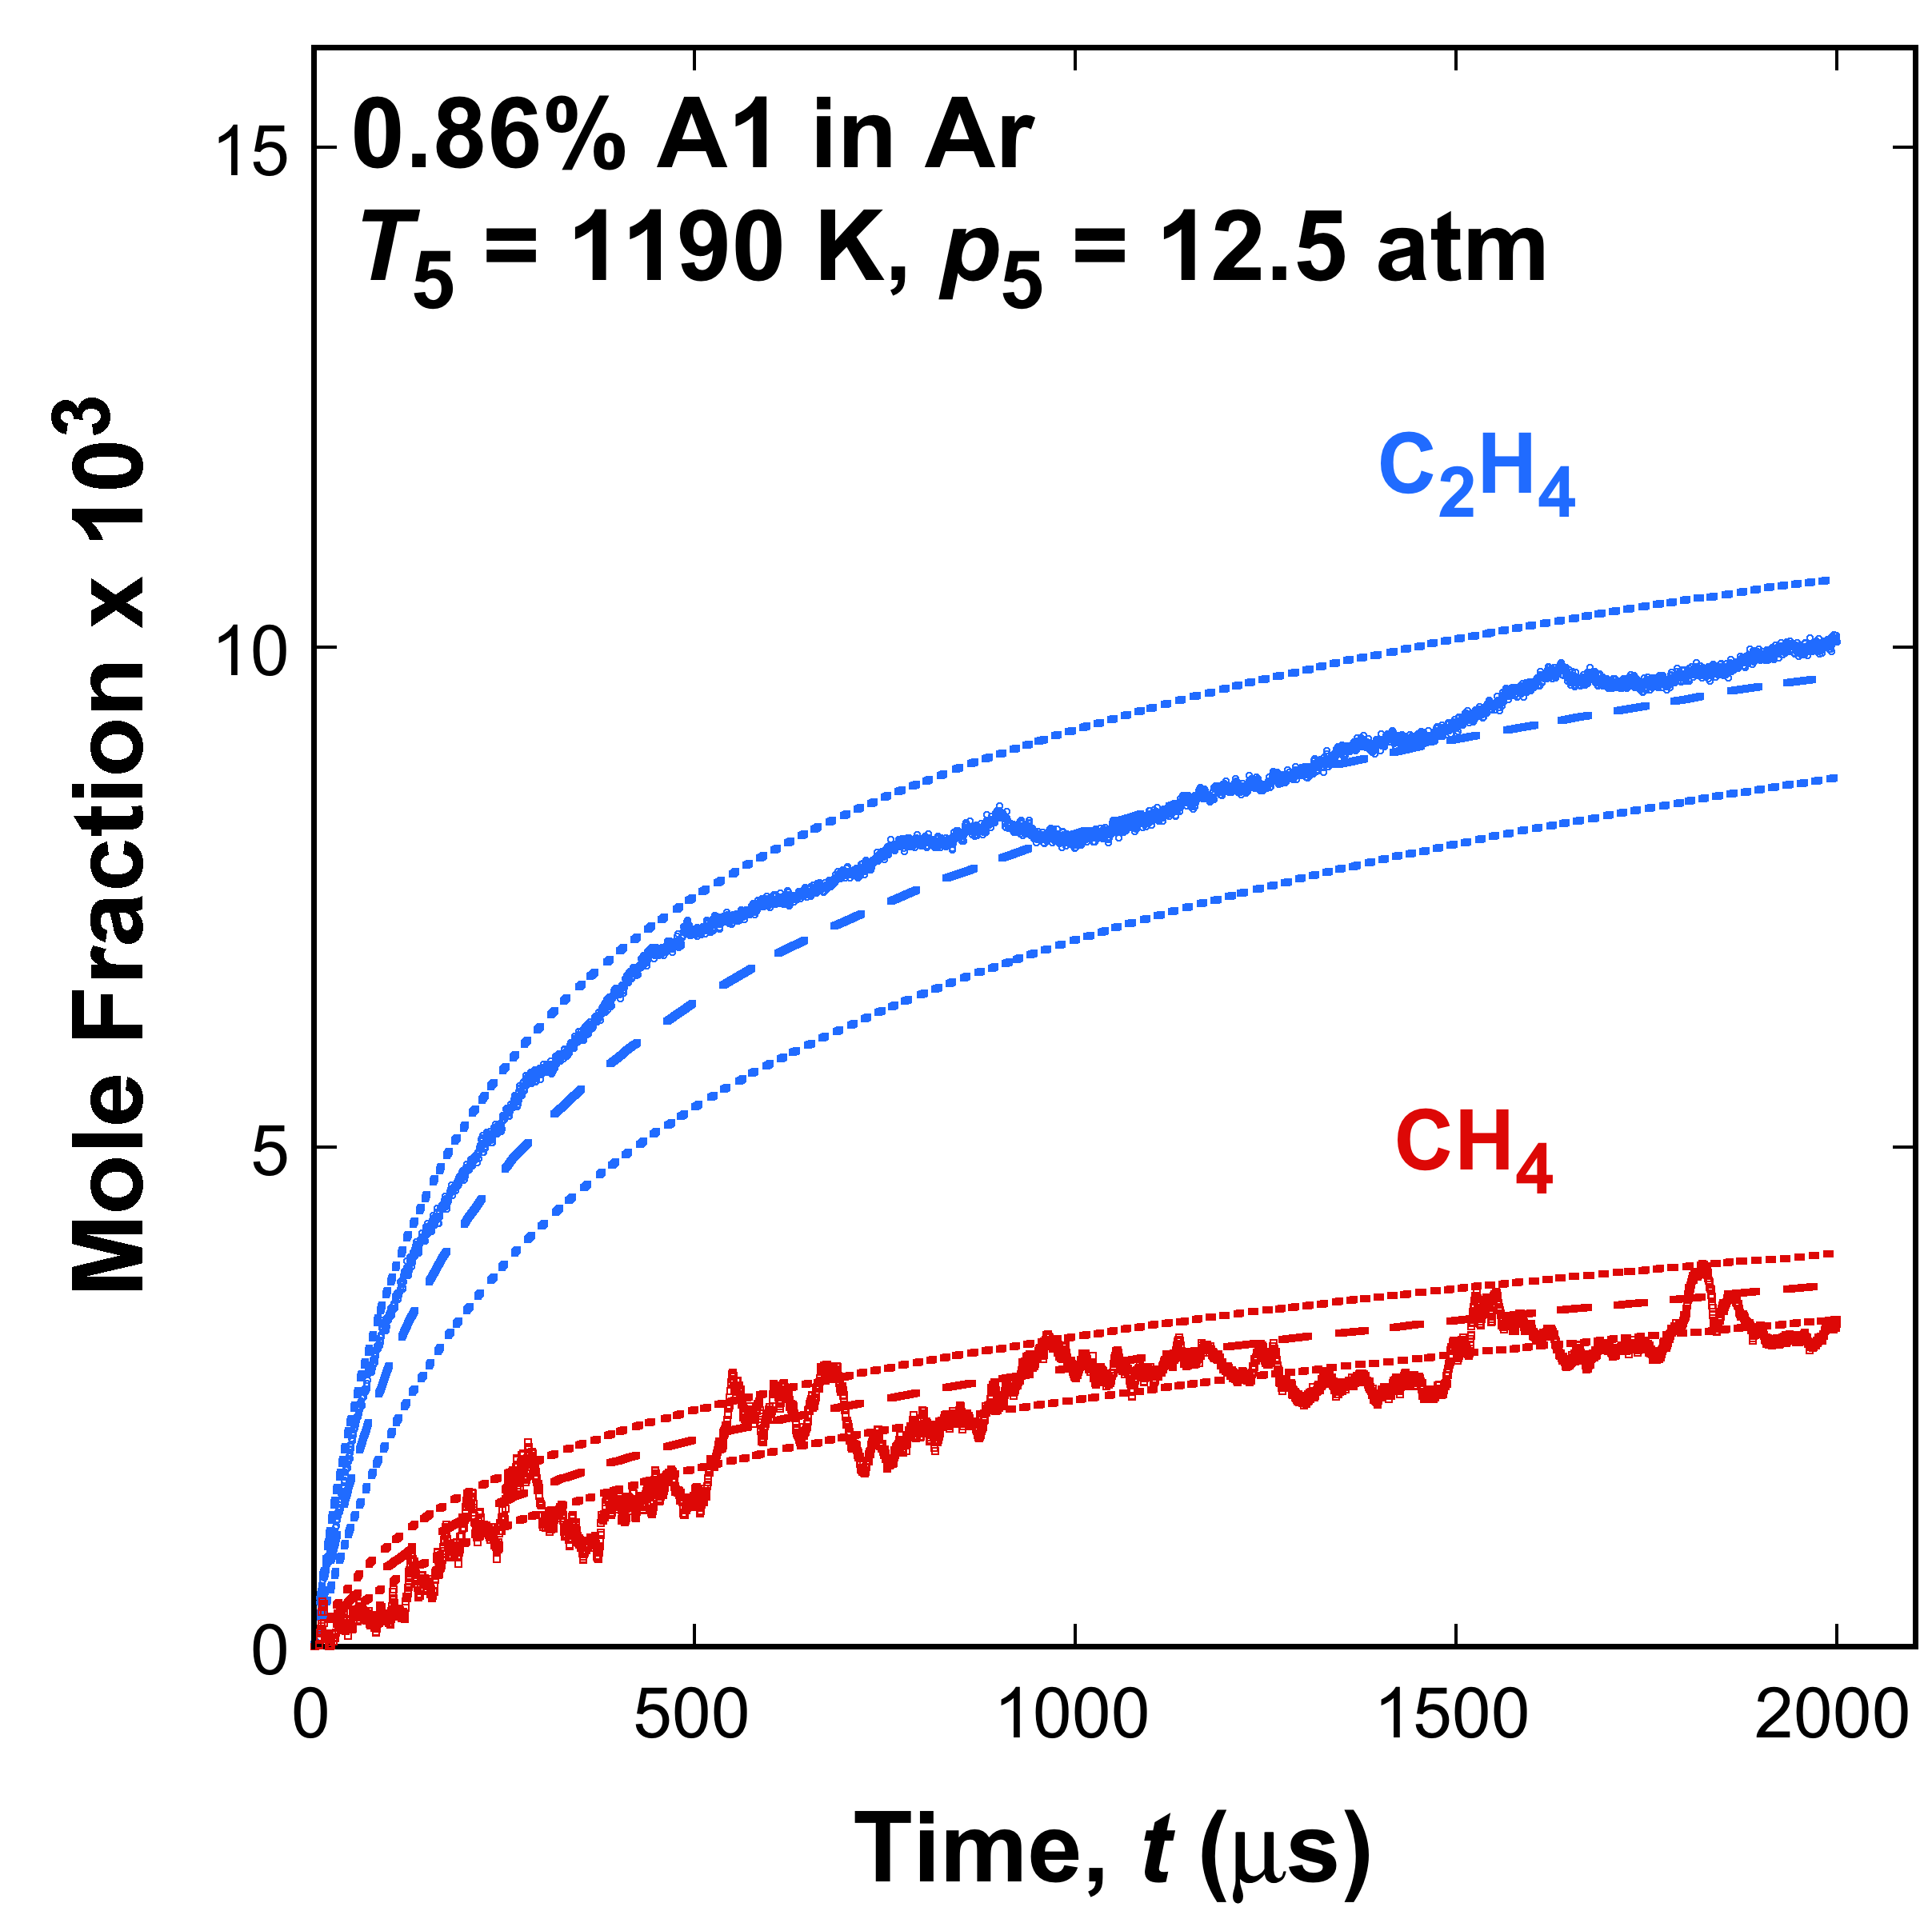

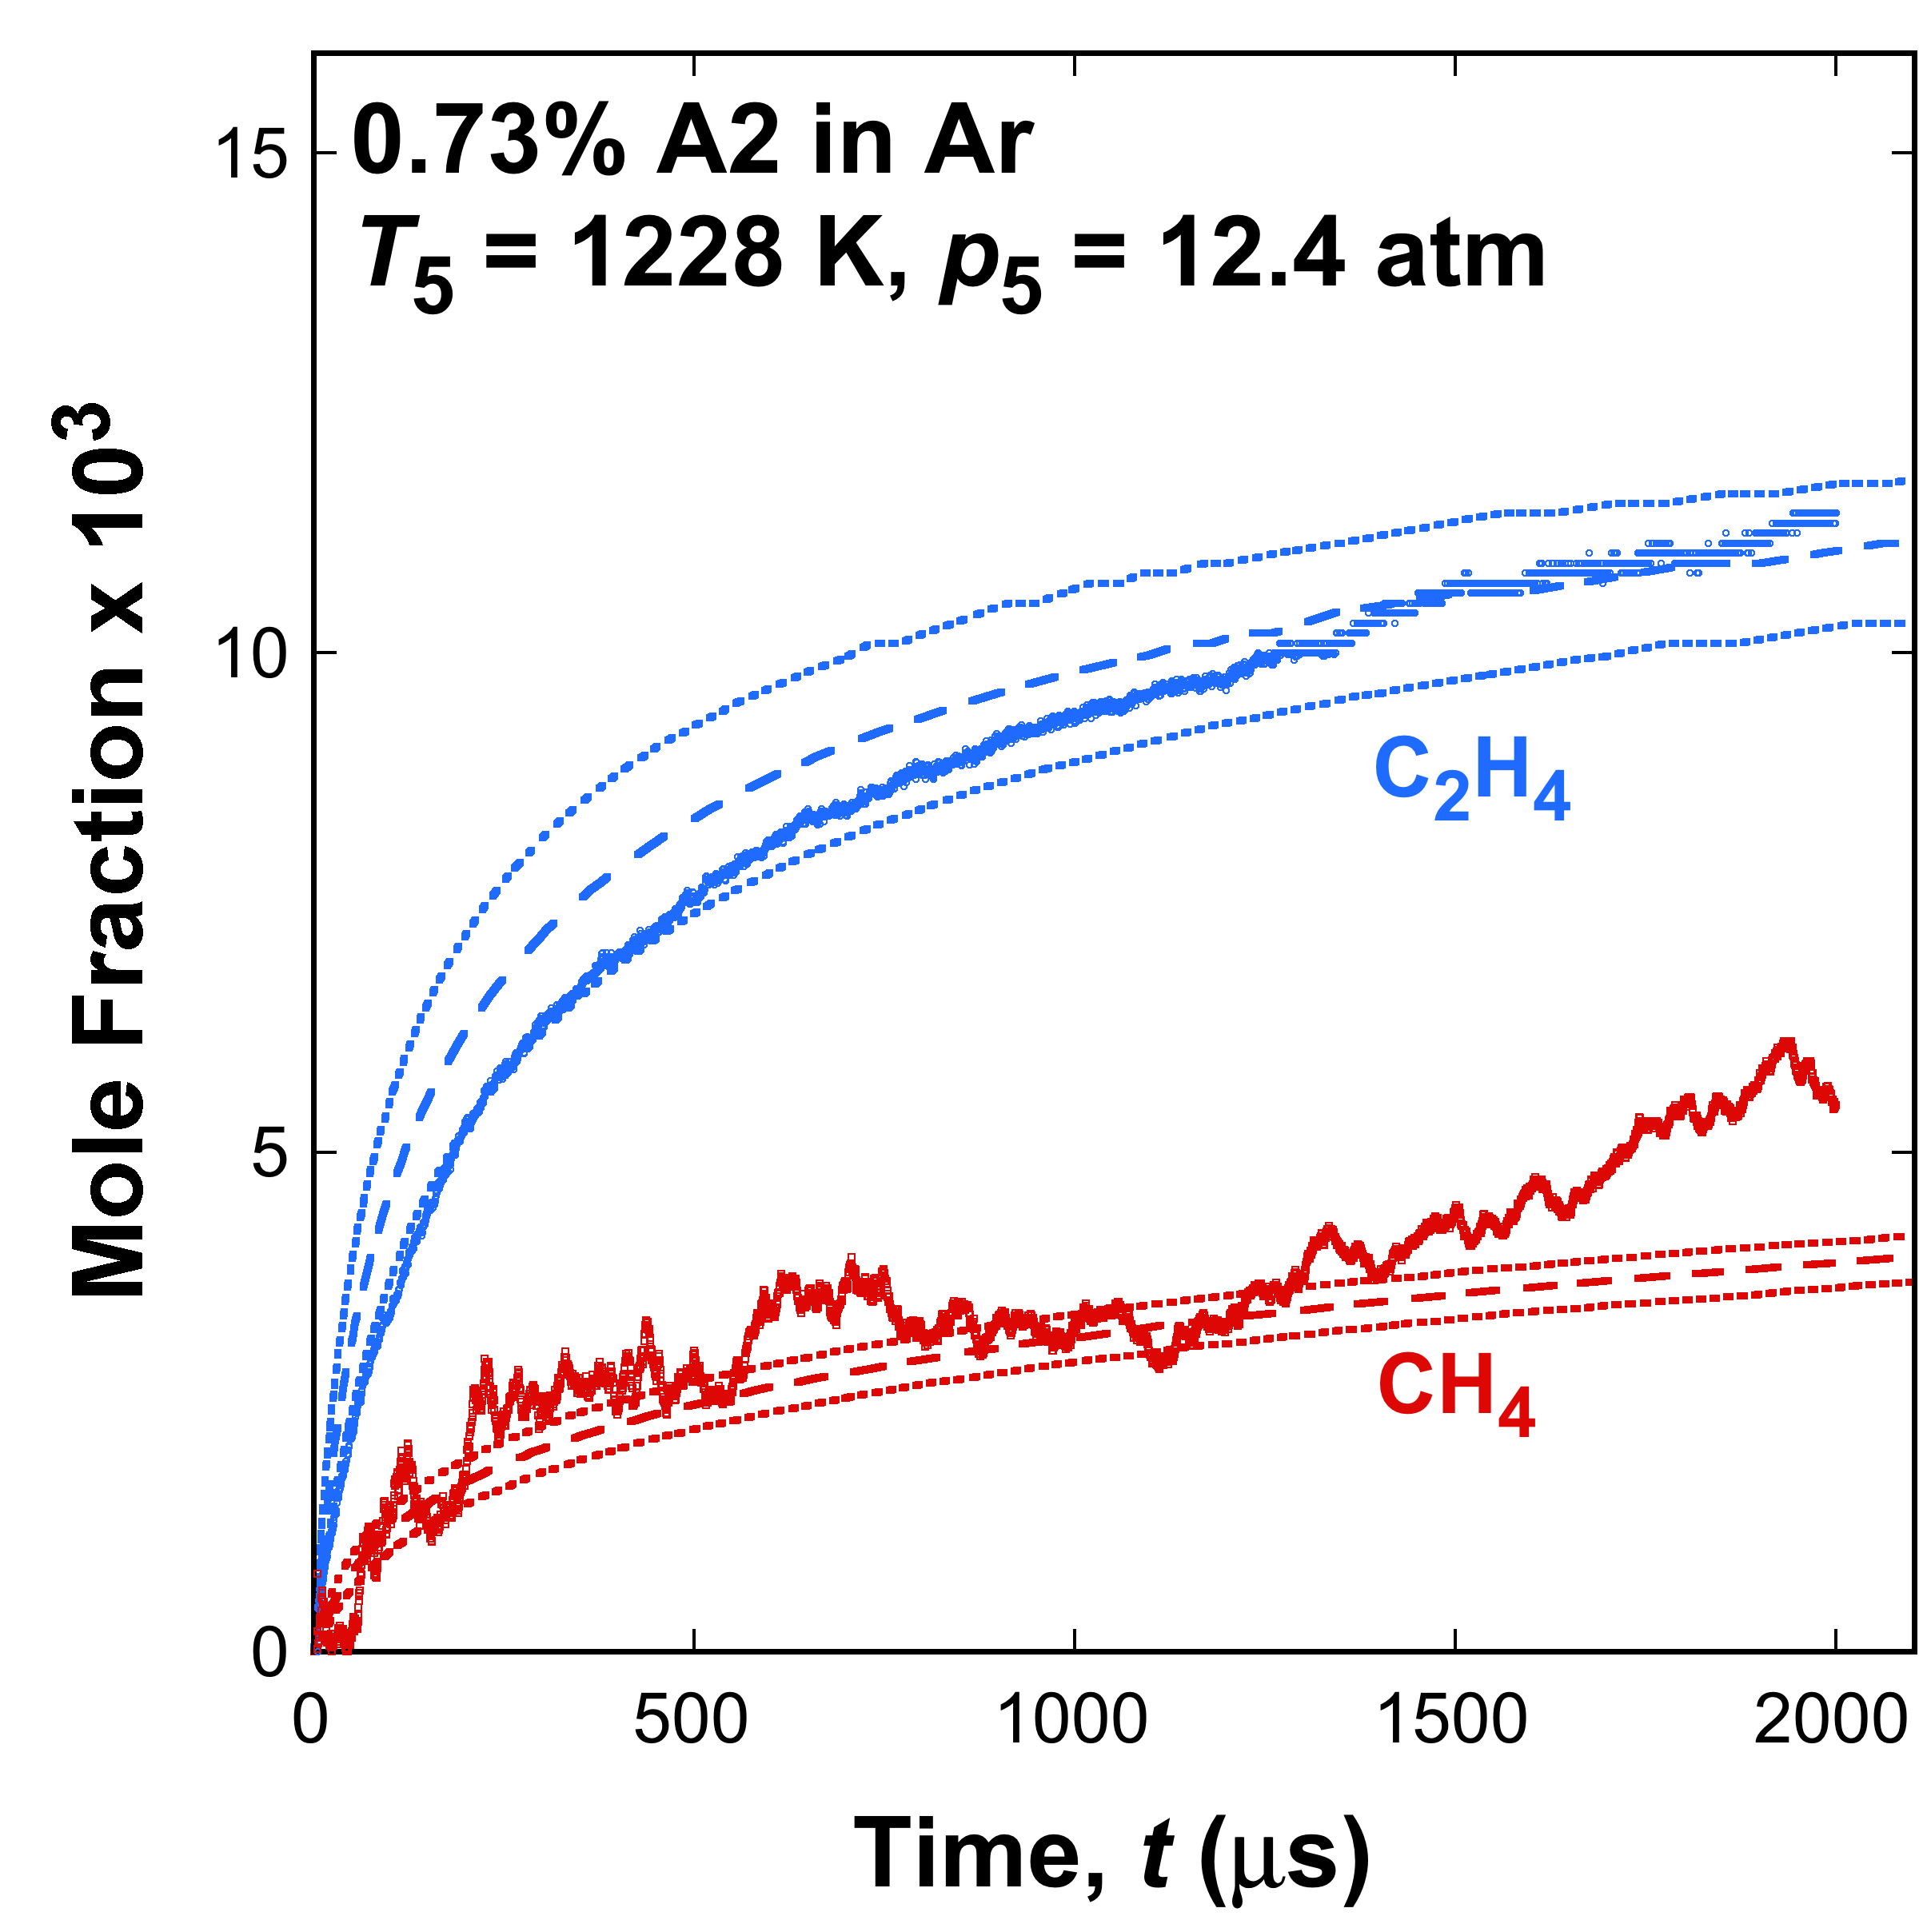

Fig. 1. Selected time histories of C2H4 and CH4 measured (symbols) and simulated (lines) from thermal decomposition of A1, A2, and A3 fuel in argon in the Stanford shock tube. The dotted lines are simulations bracketing the ±15 K temperature uncertainty. The data are taken from [1] and [2].
Reference
[1] H. Wang, R. Xu, K. Wang, C.T. Bowman, D.F. Davidson, R.K. Hanson, K. Brezinsky, F.N. Egolfopoulos, A physics-based approach to modeling real-fuel combustion chemistry - I. Evidence from experiments, and thermodynamic, chemical kinetic and statistical considerations, Combustion and Flame 193 (2018) 502-519.
[2] R. Xu, K. Wang, S. Banerjee, J. Shao, T. Parise, Y. Zhu, S. Wang, A. Movaghar, D.J. Lee, R. Zhao, X. Han, Y. Gao, T. Lu, K. Brezinsky, F.N. Egolfopoulos, D.F. Davidson, R.K. Hanson, C.T. Bowman, H. Wang, A physics-based approach to modeling real-fuel combustion chemistry - II. Reaction kinetic models of jet and rocket fuels, Combustion and Flame 193 (2018) 520-537.