
|
|
|
|
|


Fig. 1. Experimental (solid symbols) and simulated (open symbols and lines) yields of CH4, C2H4, and C5H6 at a nominal reaction time of 2 ms from JP10 pyrolysis in (a) UIC shock tube (75 PPM JP10 in Ar, p5 = 12 atm), (b) Stanford high pressure shock tube (6900 PPM JP10 in Ar, p5 = 17 atm) and (c) Stanford kinetic shock tube (10,000 PPM JP10 in Ar, p5 = 3 atm). The data are taken from [1].
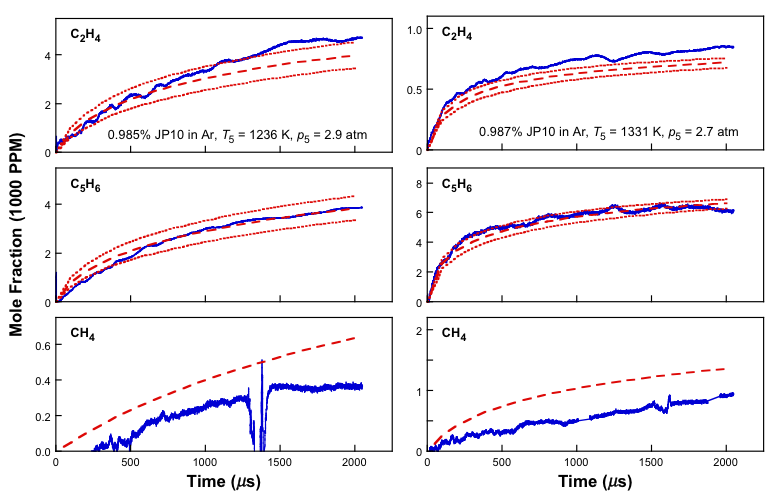
Fig. 2. Selected time histories of C2H4, C5H6 and CH4 measured (solid lines) and simulated (dashed lines) during JP-10 pyrolysis in Ar. The dotted lines are simulations bracketing the ±15 K temperature uncertainty. The data are taken from [1].
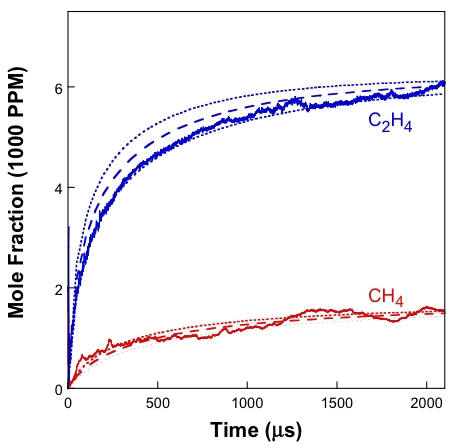
Fig. 3. Selected time histories of C2H4 and CH4 measured (solid lines) and simulated (dashed lines) during 0.72 %(mol) JP10 pyrolysis in Ar at T5 = 1363 K and p5 = 17.2 atm. The dotted lines are simulations bracketing the ±15 K temperature uncertainty. The data are taken from [1].
Reference
[1] Y. Tao, R. Xu, K. Wang, J. Shao, S.E. Johnson, A. Movaghar, X. Han, J. Park, T. Lu, K. Brezinsky, F.N. Egolfopoulos, D.F. Davidson, R.K. Hanson, C.T. Bowman, H. Wang, A physics-based approach to modeling real-fuel combustion chemistry - III. Reaction kinetic model of JP10, Combustion and Flame 198 (2018) 466–476.