


Next: Plots of summary statistics
Up: Analyzing the results
Previous: Text results.
Contents
We provide two types of plots of  (the estimated membership
coefficients for each individual, in each cluster. The first
representation comes up automatically when you click on the
corresponding run in the left-hand window. Each individual in the
data set is represented by a single vertical line, which is
partitioned into
(the estimated membership
coefficients for each individual, in each cluster. The first
representation comes up automatically when you click on the
corresponding run in the left-hand window. Each individual in the
data set is represented by a single vertical line, which is
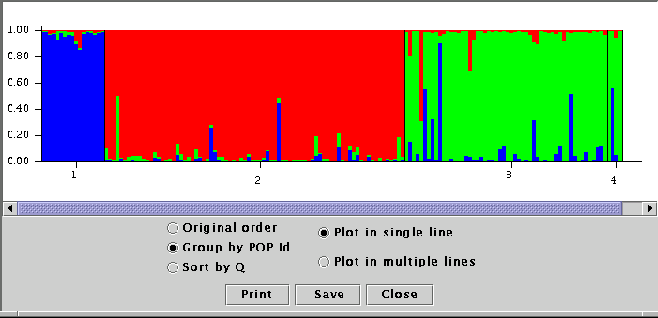
partitioned into  colored segments that represent that individual's
estimated membership fraction in each of the inferred clusters.
colored segments that represent that individual's
estimated membership fraction in each of the inferred clusters.
Figure 9:
Summary plot of estimates of  . Each individual is
represented by a single vertical line broken into colored
segments, with lengths proportional to each of the inferred
clusters. The numbers (1..4) correspond to the predefined
populations.
. Each individual is
represented by a single vertical line broken into colored
segments, with lengths proportional to each of the inferred
clusters. The numbers (1..4) correspond to the predefined
populations.
 |
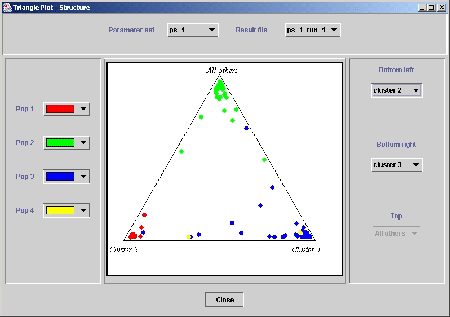
The second representation of the ancestry of individuals plots
everybody into a triangle (Figure 10). This type of
plot is useful for visualizing the data for  (Pritchard et al., 2000a). It is kind of a fun tool for exploring
higher-dimensional data, but the bar plots are usually easier to
interpret.
(Pritchard et al., 2000a). It is kind of a fun tool for exploring
higher-dimensional data, but the bar plots are usually easier to
interpret.
Figure 10:
The triangle plot of . Each individual is represented
by a colored point. The colors correspond to the prior population
labels. The estimated ancestry vector for an individual consists of
components which add up to 1. When , the ancestry vectors can
be plotted onto a triangle, as shown. For a given point, each of the
three components is given by the distance to one edge of the triangle.
Individuals who are in one of the corners are therefore assigned
completely to one population or another. For  , we represent the
data by allowing the user to pick out two of the inferred clusters at
a time, and then grouping all the other clusters together.
, we represent the
data by allowing the user to pick out two of the inferred clusters at
a time, and then grouping all the other clusters together.
 |
Next: Plots of summary statistics
Up: Analyzing the results
Previous: Text results.
Contents
Jonathan Pritchard
2003-07-10