Next:Configuring
a parameter set.Up:Front
EndPrevious:Overview.Contents
Building a project.
First you need to construct an input file. This is described in Section
2.
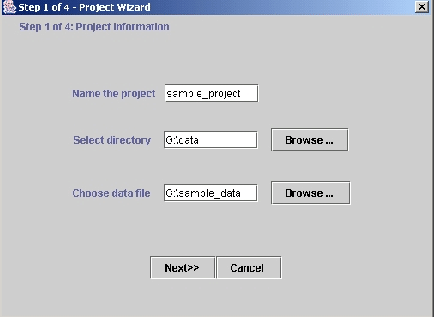
Now, click on File New
Project. This opens up a wizard to import the data (Figure 2).
The data are copied from the specified input file into the work directory
chosen for the project.
Figure 2: Importing the data (step 1). The user specifies the directory
for the
New
Project. This opens up a wizard to import the data (Figure 2).
The data are copied from the specified input file into the work directory
chosen for the project.
Figure 2: Importing the data (step 1). The user specifies the directory
for the
project (data, here), the name of the project directory (sample_project;
this is
a directory withindata), and the data file to be read by the program
sample_data.
The wizard consists of four frames:
-
Specify the project directory, project name, and input data file. (Figure
2.)
-
Specify the basic characteristics of the data file (number of individuals,
ploidy of the data (enter '2' for diploid organisms), number of loci, and
the value that is used to indicate missing data. Click on ``Show data file
format'' to get a summary of the lengths and number of lines in the data
file. (Figure 3.)
-
(Rows) Specify which, if any, of the optional extra row data are present:
row of marker names; row of inter-marker distances; and a row of phase
data after each individual. Also tick the ``single line'' box if data for
each individual are stored in a single row, instead of in the standard
format of two rows per individual.
-
(Columns) Specify which of the optional column data are there: Individual
ID (LABEL); Population of origin (POPDATA); USEPOPINFO flag- flag that
says to use the POPDATA information for certain individuals when using
the prior population information model; phenotype data (for use in association
mapping (
Pritchard et al. 2000b));
other extra columns of data prior to the genotype data that should be ignored
by structure.
When you've finished these steps, you'll get a summary of the data format;
if this looks correct, click on 'proceed'. The program will now attempt
to load the data file and create the new project (Figure 4).
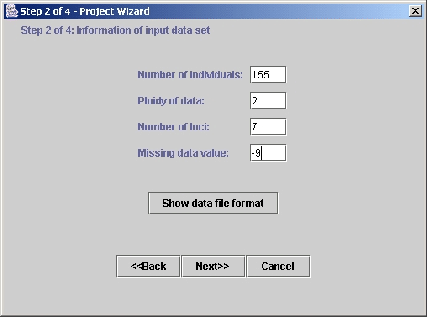 |
Figure 3: Importing the data (step 2)--Specifying
the characteristics of the data file. In this, and the next two frames
of the wizard (not shown), the user specifies the characteristics of the
data file (number of loci, number of individuals, type of data, etc).
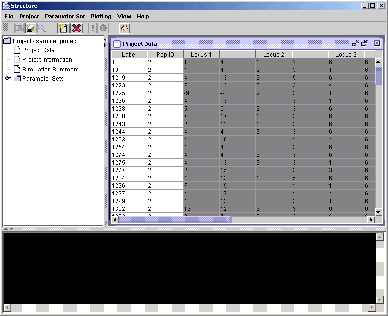 |
Figure 4: Upon successfully importing the
data, the front end loads the data file and creates the new project.
Next:Configuring
a parameter set.Up:Front
EndPrevious:Overview.Contents
William Wen 2002-07-18