


Next: Building a project.
Up: Front End
Previous: Download and installation.
Contents
The front end organizes data analysis into ``projects''. Each project
is connected to a single data file. When creating a project, the user
also provides information that specify how to read the data file
(number of loci, number of individuals, etc). These are characteristics
of the data file, and are always the same within this project.
Each project also contains one or more ``parameter sets''. These
allow the user to specify the details of the MCMC runs, including the
number of repetitions, burnin length, etc, as well as specifying the
model of analysis (e.g., whether to allow admixture, models of allele
frequencies, etc). The user can then run the Markov chain at chosen
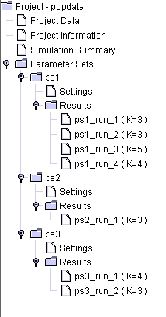
values of  , for a given parameter set. Figure 1 shows an
example of the components of a project called ``popdata''.
, for a given parameter set. Figure 1 shows an
example of the components of a project called ``popdata''.
Figure 1:
Example showing the components of a project. Project
Data is the data file; Project Information specifies data file
format. Simulation Summary provides a summary of all MCMC
simulations run as part of this project. Parameter Sets consists
of three groups of MCMC runs that used different parameter settings:
ps1, ps2, and ps3; each of these shows the Settings, as well as a list
of results for completed MCMC runs with these parameter values. The
user can click on any of these to see details.
 |
The program can then be run, using these parameter values. The front
end stores various summaries of the results, including a number of
graphical plots, described below.
Next: Building a project.
Up: Front End
Previous: Download and installation.
Contents
Jonathan Pritchard
2003-07-10