Section #7: More Nested Structures & Classes
November 1st, 2020
Written by Brahm Capoor, Juliette Woodrow & Kara Eng
Student Residences
Implement the following function:
def map_students_to_dorms(all_housing_assignments):
    """
    Given a list of length-2 tuples whose first elements are student
    names and whose second elements are dorm names, create and return
    a dictionary which associates each student with a list of all the
    dorms they lived in throughout their time at Stanford.

    all_housing_assignments contains information about undergraduates
    in every year, so some students might only have one residence whilst
    others might have multiple.

    >>> all_housing_assignments = [
        ("Juliette", "Arroyo"),
        ("Juliette", "Cowell Cluster"),
        ("Juliette", "Castano"),
        ("Chris", "FroSoCo"),
        ("Chris", "Kimball"),
        ("Chris", "Toyon"),
        ("Chris", "Roble"),
        ("Mehran", "Paloma"),
        ("Mehran", "Roble"),
        ("Mehran", "Loro"),
        ("Mehran", "Soto")
      ]
    >>> map_students_to_dorms(all_housing_assignments)
    {'Juliette': ['Arroyo', 'Cowell Cluster', 'Castano'], 'Chris': ['FroSoCo', 'Kimball', 'Toyon', 'Roble'], 'Mehran': ['Paloma', 'Roble', 'Loro', 'Soto']}
    """
Fun fact: these were actually the dorms Juliette, Mehran and Chris lived in at Stanford!
Visualizing Big Tweets
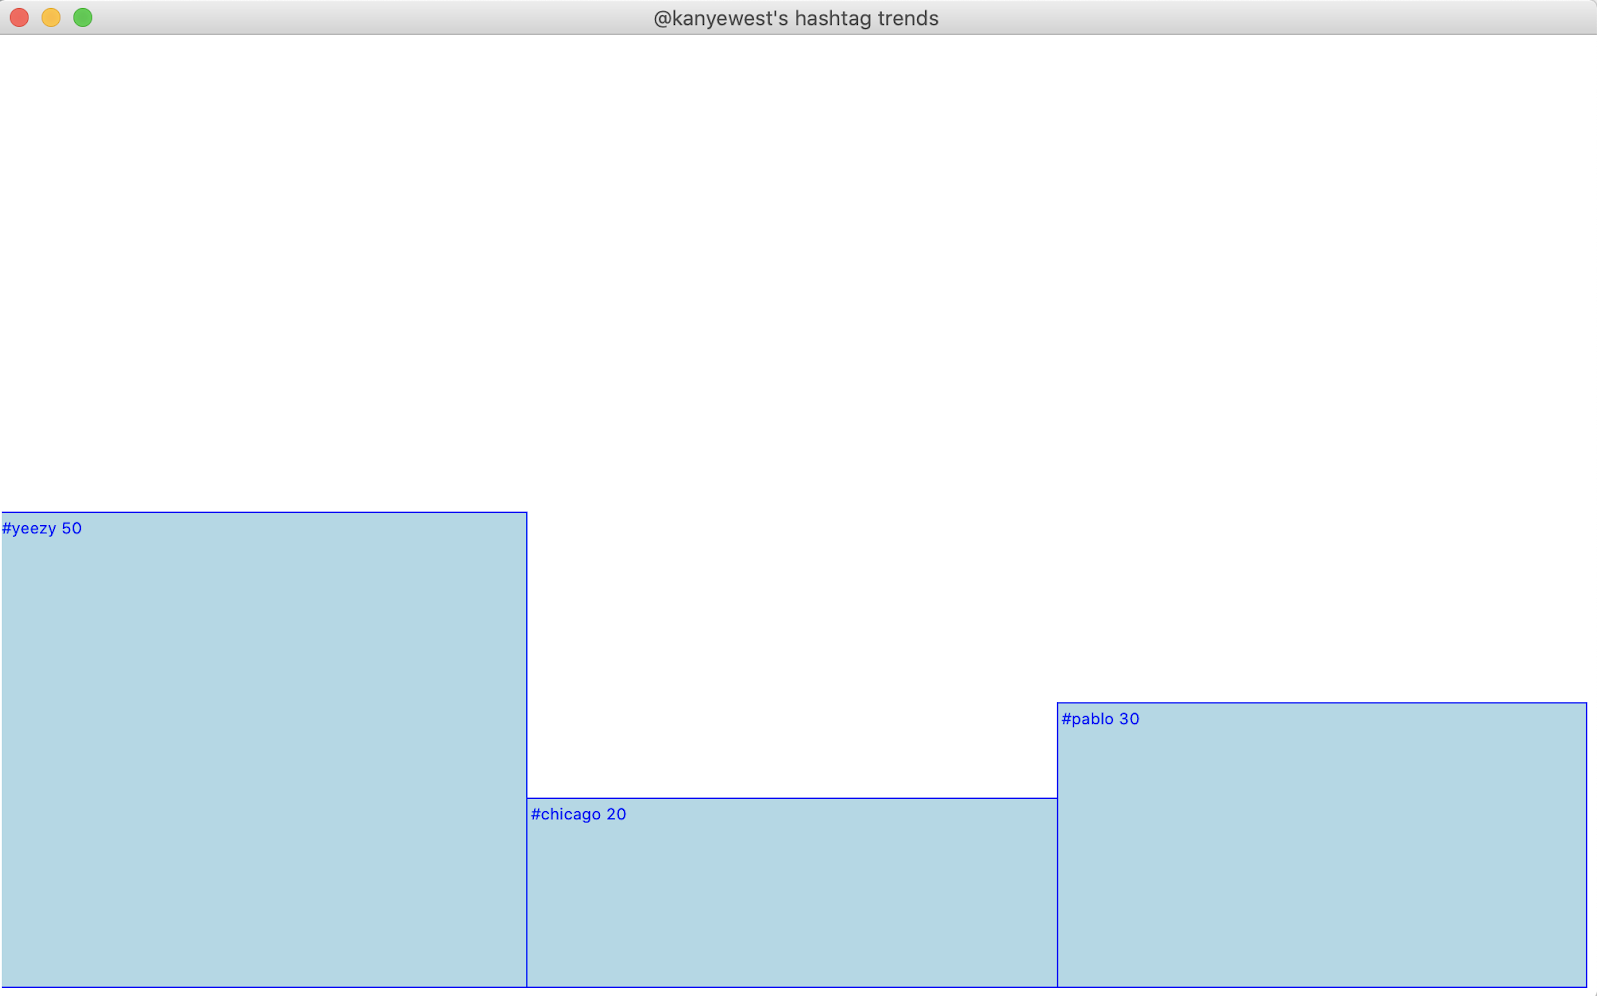
In last week's section, you implemented a program that constructs what we refer to as a user tags dictionary. This dictionary maps twitter handles to dictionaries which map hashtags to frequencies of usage. For example, suppose we have the following user tags dictionary:
{'@kanyewest': {'yeezy': 50, 'chicago': 20, 'pablo': 30}}
This dictionary illustrates the unlikely scenario in which
@kanyewest is the only user of twitter (since that is the
only key in the outer dictionary) and that he has tweeted about
yeezy, chicago and pablo 50, 20 and
30 times respectively.
Our goal is to implement a program to visualize this data for us, by
showing the relative usage of each hashtag by a user. For the dictionary
associated with @kanyewest, this visualization would look
like this:
In order to produce this visualization, you should implement the following function:
def visualize_trends(canvas, user_tags, user_name):
    """
    Draws a visualization of the top 10 hashtags used
    by the user whose handle is user_name.
    """
As you write this function, keep in mind the following details:
-
You need not worry about producing a
user_tagsdictionary. The starter code loads this dictionary in from a JSON file and passes it into your function. -
In order to keep the bars a reasonable width, you need only plot the ten
most frequently used hashtags (or fewer, if the user doesn't use many
hashtags). We've provided a function
get_top_tags, which accepts as a parameter a single user's hashtag frequency dictionary, and returns a frequency dictionary of just theTOP_Nmost used hashtags, whereTOP_Nis a constant defined to be equal to 10. - All the bars should be equal width.
-
All the bars should have a height that is proportional to their
hashtag's usage. For example, in the example above, 20% of
@kanyewest's tweets used thechicagohashtag, and so the bar forchicagois 20% the height of the canvas. Restated, the height of all the bars combined should equalCANVAS_HEIGHT.
The design and decomposition of this function is up to you, but we suggest the following milestones:
- Implement a function that-given the dimensions and coordinates of a bar, as well as the corresponding hasthag string-draws a bar and label at the top of the bar. We've provided some constants in the starter code that will be helpful here.
-
Once you have the functionality to draw a single bar working, produce a
dictionary of just the top ten hashtags for the user using the
get_top_tagsfunction. For each hashtag, plot a bar with the correct position and size.
Class Design
Your job here is to design a Circle class in
circle.py for use in the following program:
circle_test.py
# import the Circle class from circle.py
from circle import Circle

def main():
    # construct circle with radius 5
    circle = Circle (5)

    # print the area of the circle
    print("The area of the circle is " + str(circle.get_area()))

    # print the circumference of the circle
    print("The circumference of the circle is " + str(circle.get_circumference()))

if __name__ == "__main__":
    main()
When circle_test.py is run, it produces the following output
(although the calculated area and circumference might be slightly
different, depending on your computer):
$ python3 circle_test.py
The area of the circle is 78.53981633974483
The circumference of the circle is 31.41592653589793
As a reminder, a circle with radius $r$ has area $\pi r^2$ and
circumference $2\pi r$. The value of $\pi$ is stored in the constant
math.pi, which you can access by importing the
math module.