Assign2: ADT test and debug warmup
Throughout this course, you will strengthen your programming chops by writing a lot of C++ code. Having effective strategies for testing and debugging this code is a huge help when solving challenging programs along the way. Knowing your way around the debugger is key, so let's get cracking on learning how to make good use of it!
"How I got better at debugging" from Julia Evans
This exercise demonstrates use of the debugger and unit tests on the ADT types.
In this page, there are a few highlighted questions you are to write answers for in the file short_answer.txt. These answers are the only deliverable from the warmup, you do not need to submit your warmup code.
0) Personalize the Qt Creator Debugger
COMPLETE THIS STEP BEFORE BEGINNING THE DEBUGGING EXERCISE AND THE REST OF THE ASSIGNMENT
In order to help students better understand and interpret the contents of ADTs in the debugger, one of our awesome section leaders (Jeremy Barenholtz) has put together a custom debugger layout file for use specifically with the Stanford C++ Library collections. Follow the provided instructions to download this file and instruct Qt Creator to use the file when displaying collections in the debugger.
- Download the
stanfordtypes.pyfile and store it somewhere on your computer where you will be able to easily find it later. - Open up Qt Creator, and close any projects you currently have open in Qt Creator. To close a project, right-click on the project name in the project view and select the "Close Project option".
- From the top menu bar, select Qt Creator > Preferences if you're on Mac, or Tools > Options if you're on Windows / Linux. This should open up a window that looks like this (Mac view depicted below).

- Select the "Debugger" option from the left-hand menu and then click on the "Locals and Expressions" tab. This should bring up a panel that looks like this.
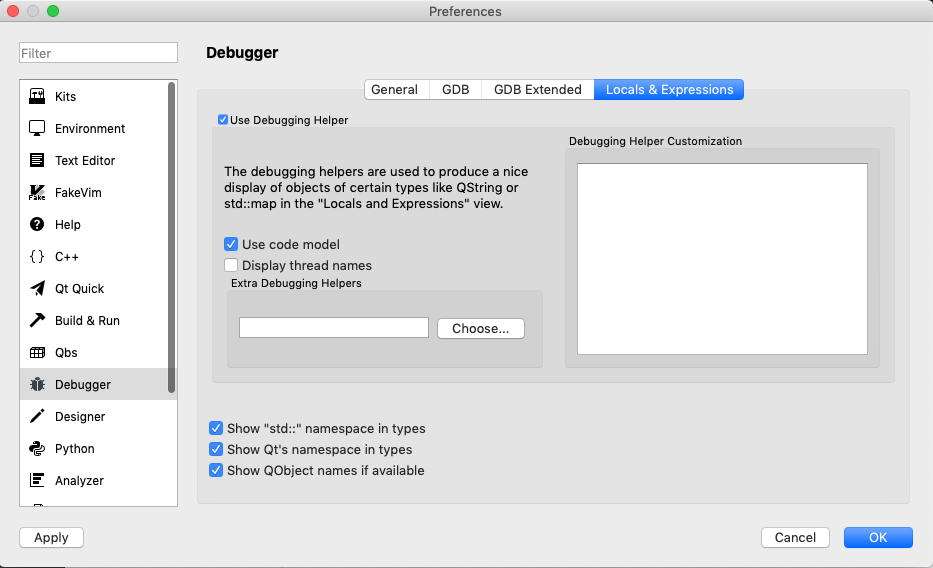
- Select the "Choose…" (or Browse… if not on Mac) option under "Extra Debugging Helpers". This should bring up a file explorer window. Use this window to find and select the
stanfordtypes.pyfile that you downloaded in Step 1. - Hit "Ok" in the bottom-right corner to apply these changes. You should be good to go!
If you completed this process correctly, you should see debugger screenshots similar to the ones provided in Part 1 of this exercise. If the screenshots don't look correct or your debugger fails to start, try revisiting steps 5 and 6 to make sure that you have selected the correct file. If you still can't get it to work, post on Ed or reach out to the teaching staff and we can help you out.
1) Observe ADTs in debugger
Start by looking over the provided code. The program has three simple ADT functions. We also provided some companion unit tests to help you find and diagnose the bugs that lurk within these functions.
The reverse function is implemented correctly and does not have any bugs in it. It uses a Stack to reverse the contents of a Queue. Run tests on adtwarmup.cpp and you'll see that this function passes its single test case. We will use this function as practice for examining ADTs in the debugger.
As you watch the variables' values, Keep in mind this question that you'll answer in short_answer.txt once you've finished stepping through the code:
- Q1. Is the first queue element displayed in debugger pane (element [0]) the element at front of queue or the back? Is the first stack element displayed on the top of stack or the bottom?
Set a breakpoint on the second line within the reverse function and run the program in Debug mode. When the debugger stops at your breakpoint, the Variables pane in the upper-right of debugger window shows the variables in scope and their values.
You should see the value of val, and the variables q and s. A nice feature of the Qt Creator debugger is that it can display the
internal contents of a collection. Expand q by clicking on the little arrow to its name in the debugger. The contents of the collection should look something like the following screenshot:

Now, continue execution into the while loop and progress until s has at least one element in it. Now, you should be able to expand s by clicking the arrow next to its name in the Variables panel. Once you have both the stack and queue expanded, step line-by-line using the Step Over button. As you step, watch the top-right pane and observe elements being added and removed.
On some systems the debugger labels elements with
indexes from [0] to [size-1], but remember these ADTs do not allow access to
elements by index. Step to the half-way point (after the first while loop has completed but before the second while loop has begun) and look at the contents of s and q. Answer Question 1 in the short answer document (question statement presented earlier in this problem description). Once you have answered the question, step through the remainder of the function until the function terminates, continuing to watch the elements in the top-right panel.
After completing this exercise, you now know how to inspect and interpret ADTs in the debugger! We hope that you will find this new tool in your toolkit helpful when working on the rest of the assignment.
2) Test duplicateNegatives
Testing and debugging are closely related. After writing a piece of code, you will want to test it to verify its behavior. If you uncover a problem, you run your test case under the debugger to further diagnose the bug.
The function duplicateNegatives is intended to modify a Queue<int> to duplicate
each negative number, i.e. turning the queue {3, -5, 10} into {3, -5, -5,
10}. The given code is buggy and does not behave correctly on all inputs.
There are some provided SimpleTest unit tests that demonstrate a few of the
inputs that are problematic. Run those tests and observe which ones pass and
which do not. The provided test cases include an input with no negative
numbers, one with a single negative number, and another with mixed negative
numbers. There is no test for a Queue of all negative numbers, so you decide to add one. Add a STUDENT_TEST for this case.
Run the tests again. When running, it seems this new case is taking a really, really long time. In fact what has happened is that the program has entered an infinite loop and is never coming back. You will have to manually stop it. You can exit a stuck program by closing the console window or choosing "Quit" from the menu bar.
Some of the inputs work correctly; others complete and yet produce wrong output; and your new test shows there is also a third category, where some inputs go into an infinite loop.
When constructing tests and analyzing buggy code, it is important to really understand what kind of inputs cause specific problems, as that can help focus the debugging process. To develop your understanding of the function, we recommend reading over duplicateNegatives carefully and tracing through it in order to develop hypotheses about what might be going wrong.
For example, you might predict that the infinite loop is triggered when all numbers in the queue are negative, but you aren't entirely confident about this hypothesis. You wonder if it might instead be specific to simply starting or ending with a negative number, or specific to having an even or odd count of negative numbers. What additional test cases can you add that allow you to confirm the precise trigger for the infinite loop?
Gather the results of your observations and answer the following questions in
short_answer.txt:
- Q2: What must be true about the input for the function to produce correct output?
- Q3: For which type of inputs does the function go into an infinite loop?
Rather than identify a specific input, we would like you to describe the general characteristics of the respective inputs.
3) Debug duplicateNegatives
Now that you've observed the buggy behavior and know what kind of input triggers it, let's use the debugger to diagnose the flaw in the code. (You may have already seen the bug when reading over the code; if so, great! But the purpose of this exercise is to show you a methodology for using the debugger that will help you in later times when you cannot spot the bug just from reading the code.)
Identify one of the failing tests from above (in particular, one that causes an infinite loop may be particularly insightful). Set a breakpoint on the call to duplicateNegatives inside the test case and then run the tests in Debug mode. If you need to break out of an infinite loop along the way, you can use the Pause/Interrupt button of the debugger.
When the breakpoint is hit, step into the duplicateNegatives function call and then step until you are at the beginning of the for loop. At this point, expand the variable q to see its contents. Run through a few loop iterations and pay attention to the changing values for i
and q. Can you use this information to explain why the loop never reaches its
intended termination condition?
Answer the following question in short_answer.txt:
- Q4. What is the bug within
duplicateNegativesthat causes it to get stuck in a loop?
Given the above detective work, you may have a fix in mind to apply to the
duplicateNegatives code. Try out that fix and see that it resolves the problem with
the infinite loop inputs. As a followup, re-test inputs that previously
terminated but with incorrect output. You should find they are also working
correctly now. In this case, the same underlying flaw was producing two
seemingly unrelated symptoms. Debugger use for the win!
4) Recognize a common ADT error in removeMatchPair
The last part of the warmup is learning how to recognize when a test case raises an error.
The function removeMatchPair is intended to modify a Map<string, string> to remove any pair where key == value.
Run the provided unit tests. It passes the first test that makes no change, but the subsequent test goes down in flames. The Map remove operation is raising an error because it is disallowed to add/remove elements in the midst of iterating over that collection. (If you think it through, you can see why this would be problematic….) Students very commonly run afoul of this restriction so we thought we'd get it on your radar before it trips you up.
When an error is raised by your code in the middle of a unit test, SimpleTest will report it with a message like the following:
Exception
    Test failed due to the program triggering an ErrorException.

    This means that the test did not fail because of a call
    to EXPECT() or EXPECT_ERROR() failing, but rather because
    some code explicitly called the error() function.

    Error: Collection modified during iteration. Iterator is now invalid.
Do not modify a collection during a for-each loop or iterator traversal.
When you see this message, it means a fatal error was raised when running the test and that the error prevented the test from completing. The error was not expected. An error generally indicates a bug in your code where it attempts to perform an illegal operation such as accessing an out of bounds index or reading a non-existent file.
You follow the same debugging process for an error condition as a failing test case: set a breakpoint and step through the test to see what has gone wrong. There is one added twist that you can step up to, but cannot step over, the actual crashing operation. If you step over an operation that crashes, the program exits, and you lose all of your debugging information. You must restart the program and step up to the crash again to regain that insightful debugging information.
After you've played around with the tests and encountered this error, go ahead and put a breakpoint on the fateful line that crashes the program. Run the tests in debugger mode and step through a couple iterations of the loop until you get to the point right before the test crashes.
- Q5: What is the state of the variables (as reported in the debugger variable pane) right before the program crashes? What happens if you try to step over the line where the program crashes?
That's it! Now that you've made it through the debugging exercise, you should be prepared with all the skills you need to attack the rest of this assignment!