Embedded Ethics in CS106B
You are now halfway through CS106B – congratulations! Being aware of your ethical responsibilities as a computer scientist and practicing evaluating your work in the social context of its use is a critical skill to have as you move on from CS106B. For this reason, the final part of this week's assignment uses data analysis and recursive backtracking to ground a discussion of gerrymandering, disenfranchisement, and civic responsibility. Our hope is that by introducing ethical reflection early in computer science education, we can help the next generation of software developers and computer science researchers—which includes you!—to make choices based on an understanding of the potential social implications of their work and to help everyone who takes CS106B to be an informed citizen who advocates for others.
A Brief Introduction to Gerrymandering
The electoral system in the United States relies on the concept of districting, which involves splitting states into smaller, geographically contiguous districts of equal population. Each district elects representatives to the national legislative body. Accurate and fair districting is critical to ensure that voters are represented by their government representatives.
Historically, a simple districting process – divide a map into equally-sized and reasonably-shaped chunks, perhaps based on existing counties – typically led to district maps that correctly captured the distribution of voters within the state and thus reflected their preferences. In most other countries and some U.S. states, this is still the case, thanks to maps drawn by non-partisan election officials. (Note: It is important to remember that for much of the U.S.'s history many people were excluded from voting, and thus “fair districting” of voters often did not reflect the preferences of all adults who lived within the state.)
However, in the last 30 years, the practice of gerrymandering district maps has proliferated. Gerrymandering is the practice of defining electoral districts in careful and contrived ways so that election outcomes favor a certain political party, and in particular so that the party can win a majority of seats without having a majority of votes. Perhaps the easiest way to visualize gerrymandering trends over time is to witness the evolution of the 7th district in Pennsylvania as shown below in a graphic by The Washington Post.
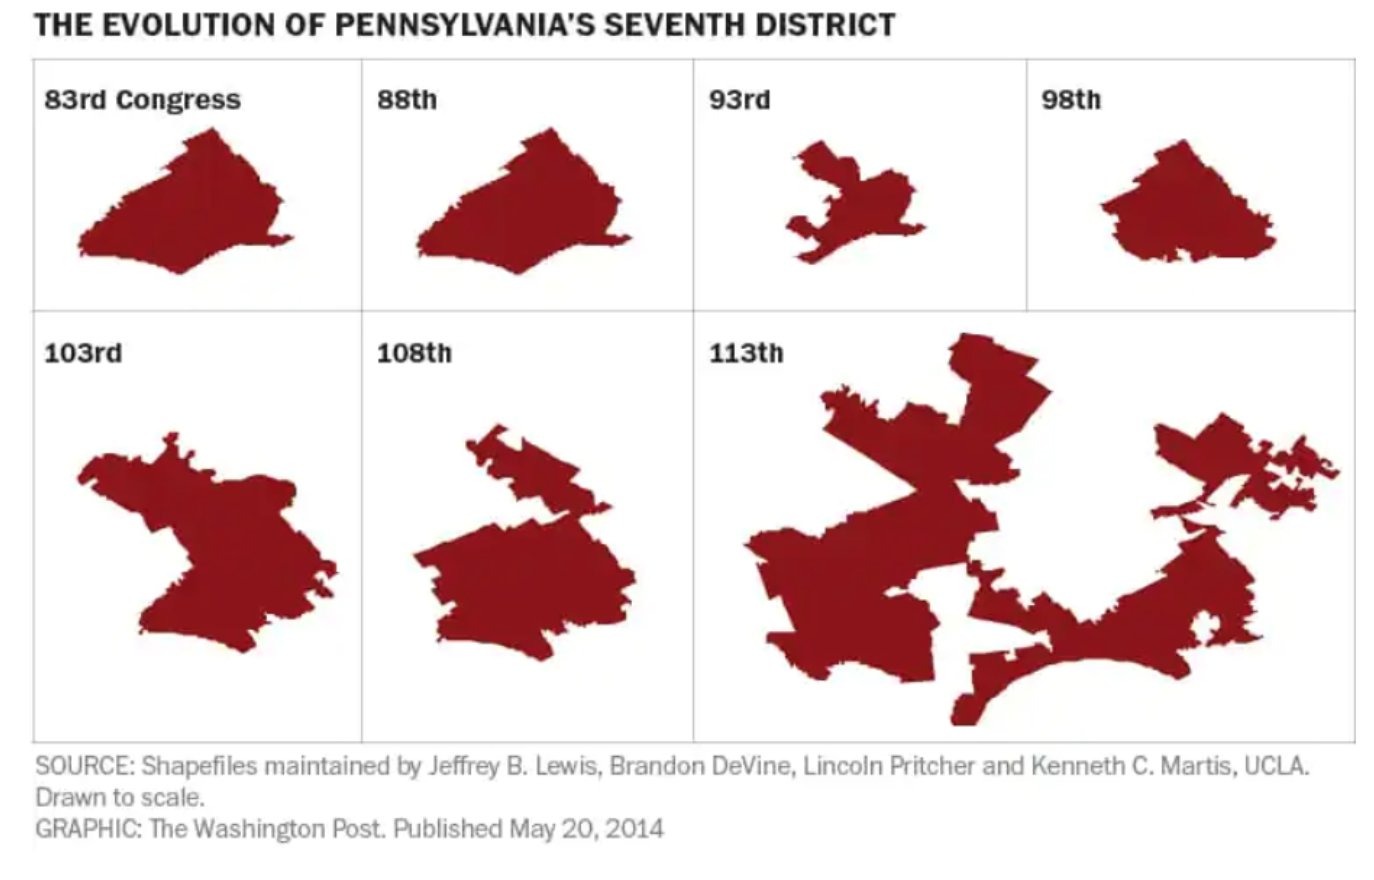 Image source: What 60 years of political gerrymandering looks like
The following graphic shows the dramatic differences in election outcomes that can happen when gerrymandering is applied to election district generation.
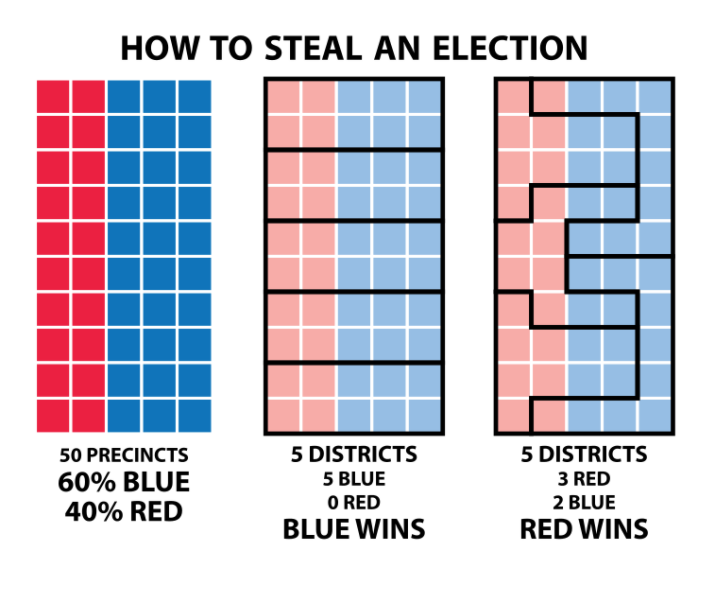
Image source: How to steal an election
While some kinds of gerrymandering are legal – the Supreme Court has upheld decisions that state gerrymandering is legal if done on the basis of factors like party voting preference but not legal if done on the basis of race, income, or other socioeconomic factors – the negative consequences of gerrymandering are immense. Heavily gerrymandered districts often result in disenfranchisement (loss of voting impact) of large swaths of a state's population and often disproportionately disenfranchise people of color, economically disadvantaged people, and others whose voting voices are often suppressed. On top of this all, in recent years, computational tools built on concepts that are not far from what you learn in CS106B have been used to gerrymander district maps to an extent that has never been seen before.
In the following two exercises, you will write code that analyzes historical election district data and code that analyzes district maps for potential susceptibility to gerrymandering. Along the way, you will also answer reflective questions that ask you to consider a programmer's responsibility in developing software tools that interface so closely with such an important social issue.
Note: While the technical terminology and examples used in this handout are specific to politics and democratic conventions in the United States, we hope the analysis sparks broader conversations about democratic representation that go beyond these specific cases. No prior knowledge of the U.S. political system is expected or required.
Part 1: Analyzing Historical Data for Evidence of Gerrymandering
Huge credit for the underlying dataset and the inspiration for this part of the assignment goes to Allison Obourn, formerly of the University of Arizona, and currently a lecturer at the University of Washington. Data and parts of this handout are borrowed from Obourn's submission to the Nifty assignments panel.
To begin with we will start by analyzing a historical dataset of U.S. electoral districts, provided in the data file res/districts.txt. The format of this data is unimportant, as we provide a utility function to read in its contents, but at a high level, this file contains information about each of the 50 U.S. states and their component electoral districts in a recent election. In our code, information about a district is represented with the following struct:
struct District {
    string name;
    int numBlueVotes;
    int numRedVotes;
}
For a given state, its component electoral map makeup is represented with a Vector<District>.
Our goal in this part of the assignment is to figure out whether a state's districts have been gerrymandered or not. To do so, we will calculate a metric called the Efficiency Gap (EG), which is based on the concept of a wasted vote. For our purposes, a wasted vote is one that was not needed to win the election in a given district – for a given party in a district this breaks down to the following cases:
- Any vote cast for the losing party is a wasted vote for that party
- Any vote cast for the winning party that was more than the simple majority needed to win is a wasted vote for that party
For example, consider the following imaginary state, consisting of 4 districts:
| Blue Votes | Red Votes | Wasted Blue | Wasted Red | |
|---|---|---|---|---|
| District 1 | 12 | 13 | 12 | 0 |
| District 2 | 17 | 8 | 4 | 8 |
| District 3 | 11 | 14 | 11 | 1 |
| District 4 | 10 | 15 | 10 | 2 |
| Total: | 50 | 50 | 37 | 11 |
To walk through these calculations in detail:
- In district 1, blue loses so all their votes are wasted. There are 25 total votes so
(25 / 2) + 1 = 13are needed for a majority. Thus, there are no wasted red votes. - In district 2, red loses so all their votes are wasted. There are 25 total votes so
(25 / 2) + 1 = 13are needed for a majority. Thus there are 4 wasted blue votes. - In district 3, all of blue's votes are wasted due to its loss. The number of votes required for a majority is
(11 + 14) / 2 + 1 = 13, so red has one wasted vote. - In district 4, again all of blue's votes are wasted. The number of votes required for a majority is again
(10 + 15) / 2 + 1 = 13, so red has two wasted votes.
Finally to calculate the efficiency gap metric, one simply applies the following formula:
Efficiency Gap (EG) = abs(wasted blue - wasted red) / total votes cast
In this case we see that the efficiency gap is abs(37 - 11) / 100 = 0.26.
In practice, researchers have established that the threshold for identifying a gerrymandered district map is 7% – if EG > 0.07, then the disadvantaged party's chances of winning election are significantly negatively impacted and the gap is hard to make up – therefore such maps are considered to be gerrymandered. If EG <= 0.07, then a state's map is not considered to be gerrymandered.
One final important note: States with fewer than three districts cannot be gerrymandered (by definition).
Your task in this part is to implement the function
bool isMapGerrymandered(Vector<District>& districts)
Which returns true if a map fulfills the gerrymandering criteria as stated above (>= 3 districts and EG > 0.07) and false otherwise.
This function should be implemented iteratively, not recursively. The recursive backtracking fun is coming in the next part!
Please answer the following questions in 3-5 sentences each in your short_answer.txt file.
Q7. Part of the power of algorithms and metrics is that they simplify problems, making them representable in data and computationally tractable. However, it is important to analyze the mathematical tools you use in their social contexts to determine when an algorithm or metric has simplified a problem too much. Efficiency gap is a useful starting place in identifying gerrymandering, but if used alone, it could be a flawed metric. Do some online research and identify one potential flaw of the efficiency gap as a metric. What additional data would you need to gather in order to more accurately determine if gerrymandering had taken place in a district?
Q8. You've written a function that can sift through data and identify historical evidence of gerrymandering. Imagine you decide to start an educational campaign about gerrymandering, either at Stanford or in another community that is important to you. How could you use your experience and the code you wrote to advocate on behalf of people disenfranchised by gerrymandering? Consider grassroots outreach, traditional and social media, voter registration drives, and lobbying. Please list the specific actions you might take.
Part 2: Identifying Maps Susceptible to Gerrymandering
The proliferation of gerrymandering has been aided by computational tools for generating "optimally" gerrymandered maps that most severely tilt the benefit of an election in the favor of one party or another. Such techniques often eschew notions of geographical compactness that used to define common sense maps and eventually produce such districts as shown below:
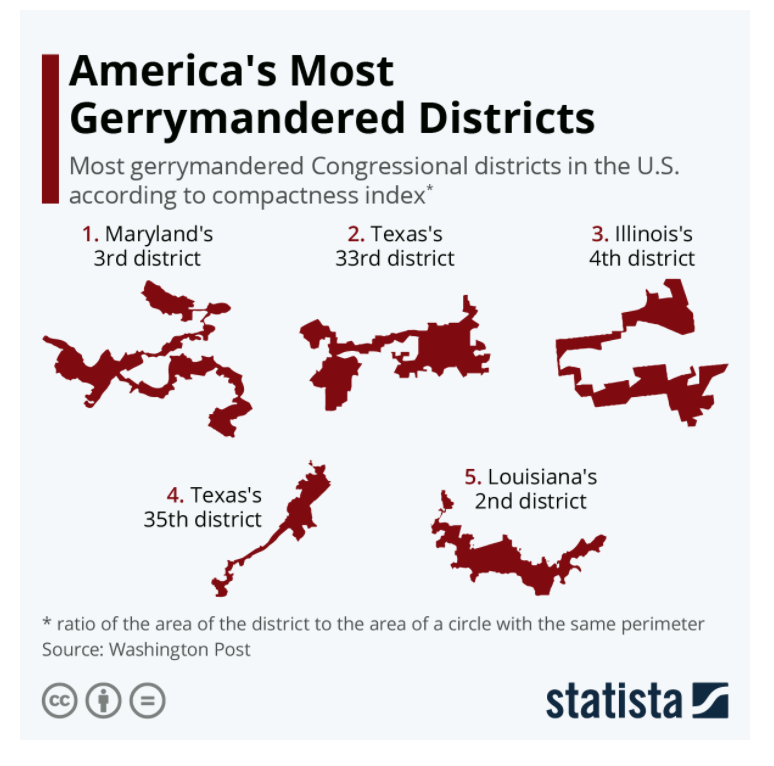
Image source: Most gerrymandered districts
These algorithms explore many possible assignments of voters to districts and look for assignments that fit a certain criteria. Framed this way, the problem sounds just like the kind of problem that we've been learning how to solve with recursive backtracking!
In this part of the assignment, we will work with a simplified problem statement that will allow you to flex your recursive muscles. The task is to create districts out of precincts, where precincts are small geographic areas that each have the same number of voters. Our electoral map will be represented as a Vector<Precinct> where the Precinct struct is defined as follows:
struct Precinct {
    int numBlue;
    int numRed;
}
We will say that this map is susceptible to gerrymandering if the following condition is true:
Consider the following example:
| Blue Voters | Red Voters | |
|---|---|---|
| Precinct 1 | 35 | 65 |
| Precinct 2 | 40 | 60 |
| Precinct 3 | 55 | 45 |
| Precinct 4 | 53 | 47 |
There are three possible ways that these precincts can be divided into two equally sized groups:
- (Precinct 1 and Precinct 2), (Precinct 3 and Precinct 4)
- (Precinct 1 and Precinct 3), (Precinct 2 and Precinct 4)
- (Precinct 1 and Precinct 4), (Precinct 2 and Precinct 3)
In the first split, red has a majority in the first district and blue has a majority in the second district, which ensures a fair split, since red and blue have similar numbers of voters (45/55). However, in both of the last two splits, we see that red has the majority in both districts – by this definition, the above map of precincts is susceptible to gerrymandering. Your task will be to write code that enumerates (via recursive backtracking) all possible valid district splits (i.e splits that create equally-sized districts) and tries to identify any split that results in the same party having the majority in both districts. If you are able to find such a split, then you have identified that the map is susceptible to gerrymandering.
In this problem, you will write a function
bool isMapSusceptible(Vector<Precinct>& precincts)
that returns true if a map is susceptible to being gerrymandered and false otherwise.
This function MUST be implemented with recursive backtracking. We strongly recommend defining a recursive helper function to solve this task – you will find it nearly impossible to do so otherwise. In addition to a recursive helper function, we have included a prototype for a non-recursive helper function that you may find helpful to implement, which simply analyzes two districts and sees if they fit the required criteria – the function prototype is reproduced below.
bool isDistrictSplitGerrymandered
(Vector<Precinct> district1, Vector<Precinct> district2, int majority)
Hint: Once you have implemented and tested this function, you may find it helpful to call it in the base case of your recursive function to determine whether a certain district allocation fits the criteria that you're searching for.
Please answer the following questions in 3-5 sentences each in your short_answer.txt file.
Q9. You've now written code that identifies maps that can be gerrymandered. An ethicist at the local university learns you did this and asks you to create a paragraph to accompany the code that explains when it should and should not be used – similar to a label on over-the-counter medicine. Write the usage paragraph for this function you just implemented. Consider referencing any quantitative thresholds or limitations as well as social impacts.
Q10. Imagine that someone in the leadership of a political party in your hometown learns you just took CS106B. They offer you a job working on cutting-edge software that applies algorithms to optimize gerrymandering during the process of district remapping. What questions might you ask about this job? What might be the benefits? What might be the drawbacks? What criteria would you use to decide whether to take the job? Please write your list of 3-5 questions and be sure to include ethical considerations.