[Menu] [Previous] [Next]
TUTORIAL: Nuclear Physics and Tomography
Instrumentation and Quality Control
Use the "Menu" button to jump to the Let's Play PET Main Menu or click on the Next (right arrowhead) and Previous (left arrowhead) buttons to proceed sequentially through the topics and tutorials. Or, you can return to the Department of Molecular and Medical Pharmacology's Home Page.Contents:
Topics:
Resolution Requirements
The use of PET in a clinical setting requires different characteristics and performance of the instrumentation, computer hardware and processing software than a system used in a research environment. The resolution in PET always has to be balanced against acceptable levels of image noise and patient throughput. For most clinical PET applications the intrinsic resolution of approximately 6 mm in all spatial directions seen today in most PET systems is adequate. At this resolution high quality images can be reconstructed at a final image resolution of 8-10 mm. These systems also have a sampling distance of approximately 3 mm in all spatial directions. The relatively uniform resolution and sampling in these systems makes them suitable for true 3-D volumetric imaging. This becomes a very important feature in, for instance cardiac imaging, where it necessary to reorient the image data into long axis views.
I. Patient Throughput
In a clinical setting, one of the most important factors is patient throughput. One would like to set up the scanner quickly for a new patient, acquire the necessary data, reconstruct and process the data, generate a film for readout and reporting and, eventually, to archive the data. The system should also be able to collect data in a multitude of modes, including simple static, dynamic, gated, and rectilinear scans.
II. Field of View (FOV)
A PET scanner should not only be designed to image one single organ, such as the brain or the heart, but should be able to image any organ in the body, including whole-body scans. Most PET systems today are whole-body systems, i.e., they have a typical transaxial FOV of 60 cm. This FOV is adequate to handle most patients. The axial FOV of most PET systems today is limited to approximately 10 cm. This relatively narrow axial FOV imposes some limitation on the imaging procedures that can be performed clinically. It also requires more accurate positioning of the patient in comparison with conventional nuclear medicine procedures. For a clinical system, it would be desirable to extend the axial FOV to 15-20 cm. This would, for instance, allow full brain and heart imaging in a single frame and more efficient whole body imaging. Since the detectors contribute a significant portion of the total cost of the scanner, however, this would bring into question what woult be an acceptable cost for the PET scanner.
III. Retractable Rings
Retractable ring (rodsources) sources reduce the radiation dose to the technologist by decreasing the handling of the source.
IV. Retractable Septa
Although retractable septa are not a must for a clinical system, with this feature the efficiency of the PET system can be improved through the acquisition of more coincidence planes. However, given the requirements of short processing time in a clinical setting, this technology has yet to reach maturity.
V. Ring Planes
Current PET systems have up to 16 ring planes, producing a total of 31 transaxial planes. The resolution is about 5 mm in all directions. This resolution is adequate for most clinical applications. With a sampling of 3 mm in all directions, one can perform studies without any detector motions.
Count Rate Performance
A PET system used in a clinical setting should be able to handle wide range of count rates, without serious losses in resolution and count rate linearity. In most clinical study protocols, such as brain FDG scans or cardiac viability studies using FDG and NH3, the injected activity does not produce count rates high enough to reach the count rate limitations of the scanner. In high count rate studies, such as 82-Rb cardiac studies, the injected activity produces high enough count rates to produce significant dead time in the system. Most systems do have built-in dead time corrections, thus producing a linear response to injected activity. However, at these high count rates there might be some losses in resolution due to event pile-up.
Acquisition Software
In a clinical setting typically only a limited set of well defined study protocols are used. It is therefore desirable, for these procedures to set up standard protocols which automatically configures the scanner for acquisition and subsequent processing. By using these pre-defined configuration procedures, a study can be started quickly. The technologist does not have to enter a large number of parameters, such as scanning times, number of frames, reconstruction parameters and other processing parameters. By using these pre-defined protocols, the system is also less susceptible to human typing errors. In defining these "canned" protocols it is, however, important to allow some flexibility in changing parameters for special cases (e.g., study time, reconstruction parameters)
Processing Software
An important aspect of clinical PET (that is many times neglected) is the necessity of fast and efficient processing software and hardware. After acquisition completion, the processing software should be able to produce a set of preliminary images before the patient leaves. The final images should, for most basic studies, be finished within 1 hour after scan completion. This requires that the processing software be highly automated and requires as little technologist interaction as possible. In a clinical PET center where 8-10 patients are scanned per day, it is very likely that there will be very little CPU time left on the acquisition computer system for processing of previously acquired studies. In order to be able to process all of the patient data, additional processing capabilities are necessary in the form of additional workstation(s). This in turn requires that the computers be networked to allow the data to be interchanged between the acquisition and processing systems.
Data Flow and Archiving
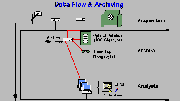
Click on image above to view full-size image.
The accompanying diagram depicts a typical network for Nuclear Medicine. The flow of data generally proceeds from acqusition to archiving and, finally, to image analysis. In a basic PET study, such as a static FDG brain scan with 15 images, approximately 24 megabytes (MB) of data are produced (including attenuation correction, normalization, emission data, and images). Of this data only 0.5 MB contains the final image data (e.g. reconstructed images). In a clinical setting, it is unlikely that the raw data will be reprocessed after the final images have been produced. Image data is, however, frequently retrieved, usually for comparing multiple studies performed on a patient. It should, therefore, be necessary to store only image data in a form that can be retrieved within a few minutes. Raw data can, in contrast, be stored on media with a greater access time. For long-term storage of all files, including the raw data, high density, slower media such as 4 mm tape can be used. Tape allows for fast archiving and provides reliable storage at a very low cost. At the present time, the most logical choice for storage of image data is optical (or magneto-optical) disk. These disks are easily handled, and data can typically be retrieved within seconds after the disk is mounted. The ability to have fast access to the data becomes especially important in a setting where films have been replaced with computer displays. Image analysis and other application programs running on workstations (e.g., Macintoshes or SUNs) can query the archive database for file information. Individual files can then be copied to a local disk on the workstation.The system should be able to collect data in a multitude of modes, such a simple static, dynamic, gated, and rectilinear scans.
Display of Image Data
One of the final steps in the processing chain of the PET study is to produce a final layout of the images for the diagnosing physician. The conventional way of presenting the image data is to produce a transparency film (x-ray film) of the images on the computer display. In addition to the image data, the film should also be labelled with demographic data about the study such as patient name and scan type. Since this information is usually stored in the image files together with the image data, the labeling and layout of the images on the display can be automated in software. With the rapid development of local area networks, films may soon no longer be necessary. Instead, the images can be read from a display system located in the reading room, which has access to the PET image data through a computer network. Referring physicians do in most cases require a hard copy of the study; this can be accomplished using x-ray films. With recent improvements in printer technology, high quality color output may also be a low cost alternative to the traditional film.
Hardware Artifacts
The most common sources of artifacts can be divided into three major groups: hardware, acquisition and processing-induced artifacts. In order to identify the sources of image artifacts seen in PET images, it is important to have a good understanding of the acquisition and processing hardware used and the different processing steps involved in producing the final PET image.
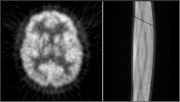
I. Coincidence Detection
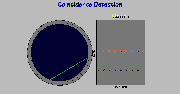
Click on image above to view full-size image.
When a valid event is detected by a pair of detectors it is sorted into a sinogram. The sinogram is a way of storing the data in a suitable way for the image reconstruction. If we look at all coincidence lines that are parallel at a certain angle, this forms a single projection view. This is stored in the sinogram as a single row. If we look at another set of parallel coincidence lines at a different angle, these then are sorted into a different row in the sinogram. All rows in the sinogram are projection views at different angles.
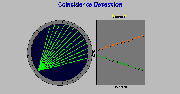
Click on image above to view full-size image.
If we look at all the coincidence lines for a particular detector we see that these form a fan. In the sinogram, it turns out that the data is stored along a diagonal line. Depending on the location of the detector, it will have a positive or negative slope.
II. Detector Failure
Click on image above to view full-size image.
The hardware induced artifacts in PET is most of the time caused by a failure in the detection system or the subsequent sorting system. The cause of these types of artifacts is most easily identified in the unprocessed sinogram data (above). The most commonly seen hardware induced artifact in PET is caused by detector failures. This is usually caused by a failure in the PMTs coupled to the scintillation crystals.
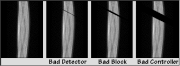
Click on image above to view full-size image.
The artifact a detector failure produces in the image is a fan like ripple. This pattern corresponds to the fan of coincidence lines that a single detector forms with its opposing detectors. In the sinogram (right), the failure of a single detector is seen as a single diagonal line (either cold or hot in comparison with its neighbors). The intensity of the artifact is dependent on the number of detectors/ring in the system. In a system with a large number of detectors, the dropout of a single detector is not likely to produce any serious artifacts.
In PET systems using modular detector systems (i.e., detection systems where a group of scintillators are coupled to a common group of PMTs), the failure of a single PMT will affect more detector channels. In the reconstructed image this is again seen as a fan like ripple, but is more pronounced in comparison with a single detector failure. In the sinogram, the failure is seen as a wide diagonal band (cold or hot, depending on the type of PMT failure). As opposed to a single detector failure, a failing detector module results in artifacts in multiple image planes.
The detectors in a PET system are typically grouped together in buckets or cassettes. The data flow from the detectors in a bucket is usually managed by a bucket controller. If the bucket controller fails, a larger number of detectors are affected and is again seen in the sinogram as a broad band. The artifact seen in the reconstructed image can sometimes be less apparent than in the case of a single module dropout due to the superposition of several fan-like ripples.
III. Memory Failure
After the detection of a coincidence event in the PET scanner, the event is sorted and counted in a histogram memory. Failure in the sorter and the histogram memory is another potential source of artifact in PET. This type of problem typically occurs when one or more memory cells are not properly initialized and are filled with an erroneous number of events. In the sinogram, this is seen as single or multiple hot spots. When this data is reconstructed, these hot spots will produce single streaks across the image.
These artifacts can be removed by manually removing these hot spots from the sinogram and re-reconstructing the data. This can, however, be a very tedious task depending on the extent of the problem. One of the best checks to determine whether the PET system is functional before an acquisition, is to acquire a data set with a rotating plane source. A visual inspection of the acquired sinograms usually reveals any kind of serious hardware problem. This check should be a part of any daily QC of the PET system.
IV. Processing Hardware
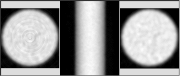
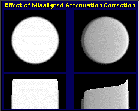
Click on image above to view full-size image.
This is an example of an artifact introduced by the processing hardware. On the left is an image of a uniform cylinder, reconstructed using a dedicated array processor. In the middle is shown the sinogram from which the image was reconstructed. The ring pattern seen in the reconstructed image resembles the ring artifacts seen in x-ray CT systems with rotating detector banks, where one or more of the detectors has failed. However, in a circular PET system any detector failure produces a fan-like artifact. If the sorting hardware fails, vertical streaks will be seen in the sinograms; this is not the case in the above example. The image on the right is a reconstructed image of the same data set, but without the array processing. In this case the artifact is gone, which provides further validation that there is indeed a problem in the array processor.
Acquisition Artifacts
As their name implies, acquisition artifacts are introduced during the acquisition of the PET data and are usually caused by patient movements. The appearance of the artifacts can vary from a loss in resolution to, in a worst case, patterns that could be interpreted as pathological changes. Even though most modern PET systems provide some means of fixation devices to prevent patient motion, these types of artifacts cannot be completely eliminated. A second category of artifact (gantry-induced), is caused by failures in the gantry itself, excluding the detector hardware. These include failures in repositioning of ring sources in the same position between blank and transmission scans, inaccurate bed motions, or other inaccuracies in the motion system of the gantry.
I. Patient Movement
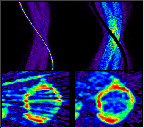
In brain studies, the image artifacts caused by patient motion is typically limited to a loss in spatial resolution. The effect of patient movements can be reduced by acquiring the data in a dynamic sequence. After the study the dynamic frames can be viewed in a cinematic mode to determine whether or not the patient moved during the acquisition. If the patient moved, only the frames that are properly aligned are summed and used in the final image formation.

Click on image above to view full-size image.
This image shows the effect of summing all the frames in the previous study (upper images) compared to summing only those frames where the patient remained motionless (lower images). We see that by summing only a part of the study, the image contrast and resolution are improved. In this way, information can be salvaged by relatively simple means.
II. Gantry Induced Artifacts
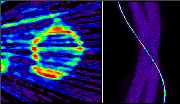
Click on image above to view full-size image.
This cardiac FDG scan is an example of an artifact introduced by the image reconstruction. The artifact seen in the image is a set streaks across the image, similar to the fan like pattern produced by a failing detector. The sinogram on the right does, however, does not reveal any failing detectors. The high intensity sine wave across the sinogram indicates that there is an area in the FOV with very high uptake.
Click on image above to view full-size image.
If the same data set is reconstructed at a smaller zoom (i.e., the full FOV is reconstructed), we see an area at the edge of the FOV with very high intensity (arrowhead, middle image). This could possibly be caused by retention of the activity at the injection site or a poorly flushed injection line. If the image is re-scaled, we see that the streaks across the myocardium originate from the high intensity region. The streaks themselves are caused by a combination of statistical noise and shortcomings in the image reconstruction algorithm. Unfortunately, in this case the intensity of the high activity area is such that the intensity of the streaks are of the same magnitude as the uptake in the myocardium, which causes the visible interference pattern.
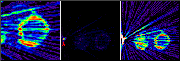
Click on image above to view full-size image.
A possible way to salvage this particular study is to mask out the high intensity area in the sinogram prior to reconstruction, which removes the artifact. Although, the streak artifacts are removed, the quantitative information in the image will most likely to be compromised or lost.
Processing Artifacts
Processing artifacts originate during the production of the final image from the acquired emission data. These types of artifacts are typically introduced by the individual processing the data; for instance, the wrong processing parameters might be entered (e.g., no attenuation correction, wrong reconstruction filter etc.). Since most of the processing steps require a minimum of operator interaction, these types of artifacts occur less frequently.
Click on image above to view full-size image.
One processing step that does require substantial operator interaction is the ellipse definition of the head outline when using calculated attenuation correction in brain studies. If not done with great care, this step can introduce serious artifacts. The above image shows a simulated cylinder with a profile drawn through it, with the ellipse incorrctly aligned and 1 cm offset (right side). With this offset we see that a eclipse type artifact is introduced.
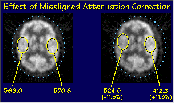
Click on image above to view full-size image.
This slide shows the same type of artifact in a FDG scan of a normal vounteer. By offsetting the attenuation ellipse by 1 cm (right image) we introduce an apparent asymmetry in activity uptake, which can be interpreted as a pathological change. The asymmetry shows an over and under estimation of activity by 11%.
Click on image above to view full-size image.
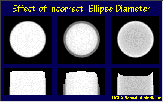
Another possible artifact introduced by the ellipse definition is the ellipse diameter. Shown here is a simulated cylinder used to demonstrate the effect of under and over estimating the ellipse dimension. We see that the over and under estimation maintains the uniformity fairly well but we see a over and under correction at the edge.

Click on image above to view full-size image.
This is again the same normal volunteer where the attenuation ellipse has been under and overestimated by 1 cm all directions. We see that no uniformity artifacts are introduced. The scalp uptake is slightly under and over estimated as expected. If we look at the data quantitatively, a larger difference is revealed. An error of up to 20% is seen when estimating the uptake activity when using an ellipse of the wrong dimensions.
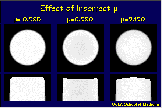
Click on image above to view full-size image.
If the wrong attenuation coefficient, or µ-value, is assigned to the area defined by the ellipse, an artifact similar to that which occurs with an incorrect ellipse diameter is seen. This is illustrated using the simulated cylinder, where the correct µ-value is 0.095 cm-1. If the µ-value is too high or too low, we see a slight over and under estimation of the activity distribution.
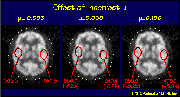
Click on image above to view full-size image.
This is again the images of the normal volunteer, where the ellipse dimensions remain constant, but the µ-value used in the different images are 0.095, 0.090 and 0.100 respectively. Again we see that by using a µ value that is too high or too low, the result is an over and under estimation in the activity levels.
[Menu] [Previous] [Next]